
“Publication differences by gender are small or statistically undetectable during graduate study, but become more pronounced by graduation and especially by the time of first permanent hire…. Teaching portfolios appear broadly similar across gender groups in terms of overall volume, though there are some suggestive differences in how teaching labor is distributed and repeated over time.”
Those are two of the conclusions drawn from a study of data gleaned from a 2025 survey conducted by Academic Philosophy Data & Analysis (APDA).
In the following guest post, Travis LaCroix, assistant professor of philosophy at Durham University and co-director of Academic Philosophy Data Analysis (APDA) discusses these and other findings.
(A version of this post is at the APDA blog.)

Gender, Publications, Teaching, and Satisfaction in the Early Stages of a Philosophy Career
by Travis LaCroix
In our previous installments, we examined broad trends in the 2025 APDA Survey, including publication rates and teaching experience, and labour conditions and financial satisfaction across academic career stages. This post focuses specifically on gender and asks how publication and teaching patterns differ across the academic pipeline.
The data suggest two broad conclusions.
First, publication differences by gender are small or statistically undetectable during graduate study, but become more pronounced by graduation and especially by the time of first permanent hire. Second, teaching portfolios appear broadly similar across gender groups in terms of overall volume, though there are some suggestive differences in how teaching labor is distributed and repeated over time.
At several points below, we discuss patterns involving respondents with non-normative gender identities. Because some individual categories had very small sample sizes, we aggregate these respondents into a broader “non-normative gender identity” category for statistical analysis. We do not report detailed statistics for categories with fewer than five respondents in order to reduce the risk of identification and to avoid over-interpreting unstable samples.
The survey sample was distributed as follows:
- (Cisgender) Man : 723/1128; 64.10%
- (Cisgender) Woman : 337/1128; 29.88%
- Non-normative Gender Identity (combined) : 68/1128; 6.03%
- Trans Man : 8/1128; 0.71%
- Trans Woman : 6/1128; 0.53%
- Non-binary : 19/1128; 1.68%
- Trans Non-binary : 23/1128; 2.04%
- Other : 11/1128; 0.98%
- Trans Other : 1/1128; 0.09%
Publication Patterns Across Career Stages
We examined reported publication counts at three career stages:
- Current graduate students,
- At time of graduation,
- At first permanent academic hire.
Because publication counts are highly skewed by a small number of prolific respondents, we relied primarily on non-parametric statistical tests (Kruskal-Wallis and Mann-Whitney U tests). [1]
Career Stage: Current Student
Among current graduate students, publication counts are relatively similar across gender groups. Statistical testing (Kruskal-Wallis) shows no significant difference by gender at this stage (p = 0.56).
The median number of publications for both cisgender men and cisgender women was 1.0. While cisgender men reported a slightly higher mean publication count (2.33 vs. 1.74), the distributions overlap substantially and the differences are not statistically significant.
| Reported Gender | Mean (Avg.) | Median | Min. | Max. | St. Dev. | Sample Size (n) |
|---|---|---|---|---|---|---|
| Cisgender Man | 2.33 | 1.00 | 0 | 50 | 4.75 | 123 |
| Cisgender Woman | 1.74 | 1.00 | 0 | 14 | 2.02 | 78 |
| Non-normative Gender Identity |
1.26 | 1.00 | 0 | 4 | 1.10 | 19 |
| Total Cohort | 2.03 | 1.00 | 0 | 50 | 3.77 | 220 |
At this stage, then, there is little evidence of a detectable publication gap.
Career Stage: At Time of Graduation
By graduation, a statistically significant divergence emerges (p = 0.0088).
Cisgender men reported a higher average publication count than cisgender women (3.16 vs. 2.20), although the medians remained identical at 2.0 publications. The difference appears to be driven less by shifts in the centre of the distribution and more by a larger “upper tail” among cisgender men—that is, a subset of especially prolific publishers.
This distinction matters because it suggests that publication inequality is not evenly distributed across the cohort. Most respondents remain clustered relatively close together, but the distribution for cisgender men contains more high-output cases.
| Reported Gender | Mean (Avg.) | Median | Min. | Max. | St. Dev. | Sample Size (n) |
|---|---|---|---|---|---|---|
| Cisgender Man | 3.16 | 2.00 | 0 | 30 | 3.76 | 383 |
| Cisgender Woman | 2.20 | 2.00 | 0 | 12 | 2.14 | 152 |
| Non-normative Gender Identity |
2.57 | 1.00 | 0 | 15 | 3.04 | 28 |
| Total Cohort | 2.88 | 2.00 | 0 | 30 | 3.38 | 563 |
Career Stage: At Time of First Permanent Hire
The publication gap widens further by the time respondents secure their first permanent academic position (p = 0.0008).
The median publication count for cisgender men at this stage is double that of women (4.0 vs 2.0), suggesting that the middle-of-the-pack candidate identifying as a cisgender man starts his first permanent position with twice the volume of peer-reviewed work as a candidate identifying as a cisgender woman.
This divergence is further amplified at the high end of the distribution. Although the single highest observed value in the sample was recorded among cisgender women, the distribution for cisgender men exhibits a substantially heavier upper tail overall, with a larger subset of individuals producing unusually high volumes of work. As a result, while most candidates cluster around the median, the mean for cisgender men is pulled upward (5.82) by a small group of high producers, whereas the distribution for cisgender women remains more compressed (4.25).
| Reported Gender | Mean (Avg.) | Median | Min. | Max. | St. Dev. | Sample Size (n) |
|---|---|---|---|---|---|---|
| Cisgender Man | 5.82 | 4.00 | 0 | 32 | 5.74 | 241 |
| Cisgender Woman | 4.25 | 2.00 | 0 | 37 | 5.78 | 106 |
| Non-normative Gender Identity |
7.06 | 3.50 | 0 | 30 | 8.66 | 16 |
| Total Cohort | 5.42 | 3.50 | 0 | 37 | 5.92 | 363 |
Importantly, however, the survey does not contain data on the amount of time elapsed between graduation and first permanent hire. This limitation matters because one possible explanation for the publication gap is that some groups may spend longer in postdoctoral or contingent positions before obtaining permanent employment, thereby accumulating additional publications.
A separate database review conducted alongside this analysis suggests that men may, on average, take slightly longer to secure permanent positions than women (roughly 1.9 years versus 1.4 years among those placed within ten years). This difference could account for some portion of the publication gap, although it does not fully resolve the broader pattern observed here.
Accordingly, the findings should be interpreted cautiously. The data clearly show divergence in publication counts by the first permanent hire stage, but they do not by themselves establish the mechanisms producing that divergence.
Publication Gap Amongst Cisgender Respondents
When comparing cisgender men and women directly, the overall pattern becomes clearer.
- During graduate study, publication differences are statistically indistinguishable (p = 0.260).
- By graduation, cisgender men report significantly higher publication counts, graduating with nearly one full publication (0.96) more, on average, than cisgender women (p = 0.001).
- By first permanent hire, the gap becomes larger still (p < 0.001). At this stage, the median for cisgender men (4.0) is double that of cisgender women (2.0), with an absolute difference of 1.56 additional articles published, on average, by cisgender men. [2]
The increase is visible both in average publication counts and in the shape of the distributions themselves. Cisgender men are more likely to appear among the highest-publication respondents in the sample.
Between graduation and the first permanent hire, the absolute “publication advantage” in mean articles for cisgender men increases by more than 60% (from 0.96 to 1.56).
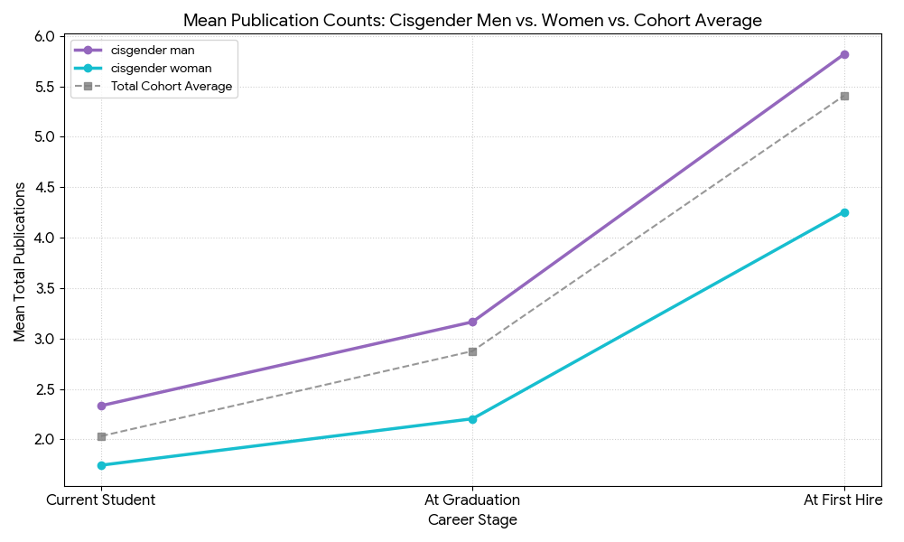
Again, caution is warranted in interpretation. Publication output may also vary across fields, areas of specialisation, institutional placement, co-authorship norms, or time-to-hire patterns. Differences in area of specialization (AOS), in particular, may affect publication expectations and timelines in ways not captured by the present dataset.
The data therefore establish a robust pattern of divergence, but they do not by themselves identify a single causal explanation. Nonetheless, these data suggest that this gendered publication gap is not a static phenomenon but one that compounds over time. The gap transitions from a non-significant variance during graduate school into a robust, statistically significant disparity by the time candidates enter the job market; moreover, this disparity continues to increase through the time a candidate obtains their first permanent position.
Teaching Experience Across Career Stages
We also examined teaching experience by gender at the same three career stages. Two measures were used:
- Types: number of distinct courses taught (breadth)
- Tokens: total course offerings taught (depth/volume)
Across most stages, teaching differences between gender groups were comparatively small and generally not statistically significant.
Current Students’ Teaching Experience
Among current students, all groups reported very similar teaching profiles. Median teaching breadth and volume were nearly identical across groups, and no statistically significant differences were detected (p = 0.535).
This suggests that early teaching opportunities during graduate study are distributed relatively similarly across gender categories within the sample.
| Metric | Reported Gender |
Mean (Avg.) | Median | Min | Max | St. Dev. | Sample Size (n) |
|---|---|---|---|---|---|---|---|
| Types | Total Cohort | 2.69 | 2.00 | 0 | 27 | 2.94 | 264 |
| Cisgender Man | 2.89 | 2.00 | 0 | 27 | 3.38 | 151 | |
| Cisgender Woman | 2.49 | 2.00 | 0 | 12 | 2.34 | 90 | |
| Non-normative Gender Identity |
2.09 | 2.00 | 0 | 5 | 1.57 | 22 | |
| Tokens | Total Cohort | 4.40 | 2.00 | 0 | 50 | 5.98 | 205 |
| Cisgender Man | 4.76 | 2.00 | 0 | 50 | 6.86 | 123 | |
| Cisgender Woman | 3.73 | 2.00 | 0 | 24 | 4.35 | 64 | |
| Non-normative Gender Identity |
4.24 | 2.00 | 0 | 15 | 4.40 | 17 |
Teaching Experience at Time of Graduation
At graduation, there were still no statistically significant differences in teaching experience overall (p = 0.563).
| Metric | Reported Gender |
Mean (Avg.) | Median | Min | Max | St. Dev. | Sample Size (n) |
|---|---|---|---|---|---|---|---|
| Types | Total Cohort | 4.97 | 3.00 | 0 | 50 | 6.29 | 622 |
| Cisgender Man | 4.74 | 3.50 | 0 | 50 | 5.54 | 412 | |
| Cisgender Woman | 5.53 | 3.00 | 0 | 50 | 7.81 | 176 | |
| Non-normative Gender Identity |
3.82 | 3.00 | 0 | 20 | 3.88 | 28 | |
| Tokens | Total Cohort | 7.65 | 5.00 | 0 | 50 | 8.81 | 539 |
| Cisgender Man | 7.81 | 5.00 | 0 | 50 | 9.03 | 366 | |
| Cisgender Woman | 7.44 | 5.00 | 0 | 50 | 8.55 | 142 | |
| Non-normative Gender Identity |
5.96 | 4.00 | 1 | 32 | 6.89 | 25 |
Some average differences appeared in the data:
- Cisgender women reported slightly higher average numbers of distinct course types.
- Cisgender men reported slightly higher average numbers of course tokens.
However, these differences were small relative to the overall spread of the distributions and appear to be driven largely by outliers rather than broad group-level separation.
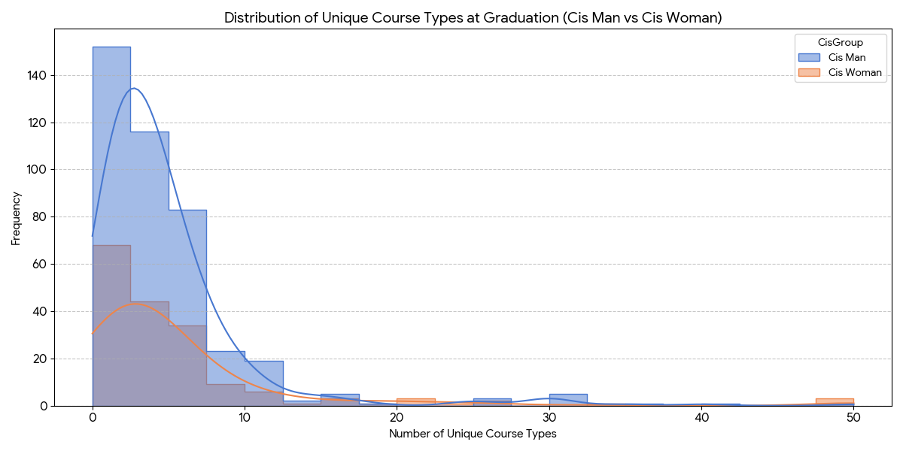
In other words, although there are hints of different teaching patterns, the evidence at this stage is not strong enough to support firm conclusions about systematic gender differences in teaching breadth or volume.
Teaching Experience at Time of First Permanent Hire
At the first permanent hire stage, overall teaching differences between cisgender men and women again remained statistically non-significant.
| Metric | Reported Gender |
Mean (Avg.) | Median | Min | Max | St. Dev. | Sample Size (n) |
|---|---|---|---|---|---|---|---|
| Types | Total Cohort | 7.51 | 5.00 | 0 | 50 | 8.74 | 372 |
| Cisgender Man | 7.81 | 5.00 | 0 | 50 | 9.14 | 241 | |
| Cisgender Woman | 7.25 | 5.00 | 1 | 50 | 8.45 | 113 | |
| Non-normative Gender Identity |
5.38 | 4.00 | 2 | 13 | 3.38 | 16 | |
| Tokens | Total Cohort | 7.65 | 5.00 | 0 | 50 | 8.81 | 539 |
| Cisgender Man | 7.81 | 5.00 | 0 | 50 | 9.03 | 366 | |
| Cisgender Woman | 7.44 | 5.00 | 0 | 50 | 8.55 | 142 | |
| Non-normative Gender Identity |
8.13 | 7.00 | 2 | 20 | 5.07 | 15 |
However, when cisgender respondents were compared collectively against respondents reporting non-normative gender identities, statistically significant differences emerged.
At first permanent hire:
- Cisgender respondents (men and women combined) averaged 7.63 course types, compared to 5.38 among respondents reporting non-normative gender identities (p = 0.03).
- Cisgender respondents averaged 11.28 course tokens, compared to 8.13 among respondents reporting non-normative gender identities (p = 0.04).
These findings may reflect differences in professional opportunities, teaching assignments, institutional trajectories, or other structural factors in the transition from graduation to permanent employment. However, interpretation should remain cautious given the relatively small sample size of the non-normative group at this career stage (n = 16).[3]
Repeat Rates and Teaching Structure
To better understand how teaching labor is distributed, we examined “repeat rates”: the ratio between total course offerings (tokens) and distinct courses taught (types).
A higher ratio suggests that instructors teach the same courses repeatedly, whereas a lower ratio suggests more frequent development of new course preparations.
Across the dataset as a whole, repeat rates were relatively stable across career stages and gender groups. Most observed differences were not statistically significant. [4]
At the first permanent hire stage, cisgender men showed a somewhat higher repeat rate than cisgender women. However, the differences were modest and statistically non-significant.
Given the small magnitude of these differences, they should not be overstated. [5]
Exploratory regression analyses suggested one potentially noteworthy pattern during graduate study: cisgender women appeared somewhat less likely than cisgender men to accumulate repeated offerings from previously developed courses. Put differently, women in the sample may have been somewhat more likely to teach “one-off” preparations.
Beyond looking at the simple ratio of tokens to types, we can explore the absolute individual difference (Tokens minus Types) and the marginal relationship (how much each new course type contributes to the total teaching load). By running a linear regression (Tokens ~ Types x Gender), we can estimate the “marginal return” on each new course developed. In this way, we can see if the “reward” for teaching a new course differs by gender—namely, for every new unique course type a person develops, how many total tokens do they get in return?
| Career Stage | Gender Group | Marginal Return (Slope)* | Predictability (R^2) | Sig. vs Cis Man (p) |
|---|---|---|---|---|
| PhD Years | Cisgender Man | 1.57 | 0.63 | — |
| (Current Students) | Cisgender Woman | 1.04 | 0.31 | 0.031 |
| Non-Normative | 1.77 | 0.44 | 0.742 | |
| At Graduation | Cisgender Man | 0.90 | 0.25 | — |
| Cisgender Woman | 0.68 | 0.21 | 0.117 | |
| Non-Normative | 0.52 | 0.09 | 0.343 | |
| First Hire | Cisgender Man | 0.41 | 0.10 | — |
| Cisgender Woman | 0.63 | 0.18 | 0.168 | |
| Non-Normative | 0.51 | 0.12 | 0.896 |
Key to Table: Marginal Return (Slope): The number of teaching slots (Tokens) an instructor receives for every 1 new unique course title (Type) they develop. A slope of 1.0 indicates a 1:1 ratio (all “one-off” courses), while a higher slope indicates more “recycling” of previous labor. Predictability (R2): Measures how much of the total teaching volume is explained by the number of unique preparations. A high R2 (0.63) indicates a more rigid, predictable labor structure. Sig. vs Cis Man (p): The p-value from the interaction term (Types x Gender). The value of 0.031 confirms that the “Efficiency Gap” during the PhD years is a statistically significant disparity.
Again, these results should be interpreted carefully. The regression model is exploratory, and several alternative explanations are plausible, including disciplinary specialisation, departmental assignment practices, or institutional differences. The evidence here is suggestive rather than conclusive.
Summary of Teaching Workload
Current students (left) shows the highest degree of “efficiency” for cisgender men and individuals with non-normative gender identities, where the slope is steepest, meaning that for every new course title developed, they are likely to teach it multiple times. In contrast, cisgender women show a significantly flatter slope (p = 0.031), indicating they are frequently teaching “one-off” courses without the benefit of repeats during their PhD years.
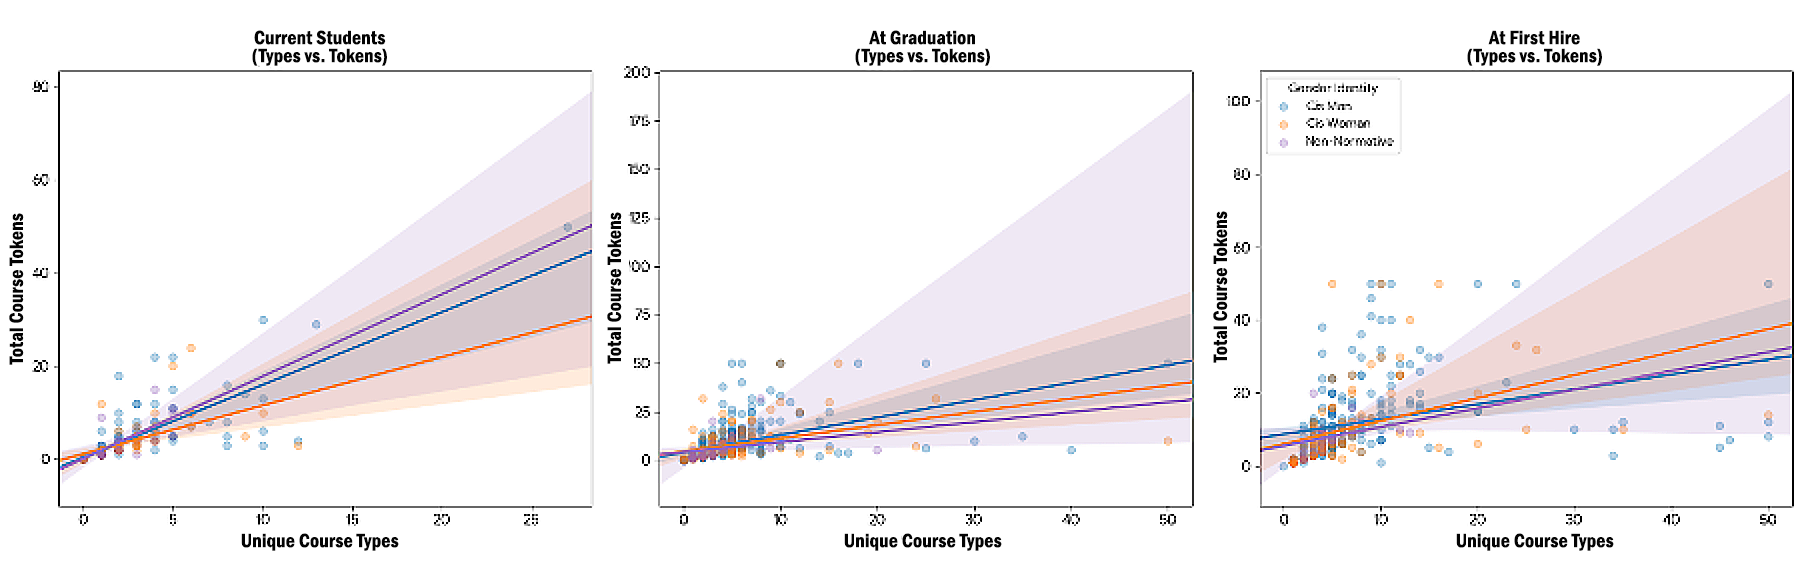
At graduation (middle) shows that as the cohort finishes their PhDs, the slopes begin to converge. However, the non-normative gender identity group (purple line) shows the shallowest slope at this stage, suggesting that while students who reported non-normative gender identities may have a high volume early on, by graduation, their portfolios are characterised by high breadth (Types) with diminishing depth (Tokens) relative to their cisgender peers.
By the time individuals secure a permanent position (right), the “predictability” of the relationship breaks down (indicated by the wider confidence intervals and lower correlation coefficients). The slopes are much flatter for all groups at this stage, reflecting that permanent hires may come with a wide variety of background teaching experiences that do not follow a simple linear “prep-to-repeat” ratio.
Program Climate and Academic Experience
The survey also identified significant differences in perceptions of program climate.
Respondents reporting non-normative gender identities reported the lowest average levels of program satisfaction (3.76/5), followed by cisgender women (3.94/5), while cisgender men reported the highest satisfaction levels (4.28/5). These differences were statistically significant (p < 0.001).
Interestingly, there is a “mismatch” once these individuals enter the workforce. Despite the disparities in salary—where cisgender men earn significantly more (p = 0.021)—the “Job Satisfaction” scores for cisgender women (4.26) slightly exceed those of men (4.19). These findings suggest that perceptions of institutional climate and belonging vary substantially across gender groups, even where objective career outcomes partially converge later in the pipeline.
This may suggest a “survivorship bias” or a higher threshold for entry; women and non-binary individuals who successfully navigate the “teaching tax” and the “climate gap” to reach permanent hire may value those positions more highly, or have developed greater resilience, despite lower financial compensation.
Finally, our data shows that the “academic-only” focus is most rigid among cisgender men. 88% of men reported an academic career as their singular priority, a statistically higher rate than their peers (p = 0.044).
By considering these interaction effects in combination, a possible narrative emerges: Cisgender men enter the field with a more singular focus, navigate a more welcoming climate, and benefit from a teaching structure that allows them to produce more research in less time. For cisgender women and individuals with non-normative gender identities, the path is characterized by higher “invisible labor” in teaching and a more taxing institutional climate, requiring them to be more resilient and multi-faceted to achieve similar employment outcomes.
Key Takeaways
• Gendered gaps in publication experience emerge late in the pipeline. Publication differences are small during graduate study but become statistically significant by graduation and widen further by first permanent hire.
• Gendered differences in teaching experience are weaker and less consistent. Overall teaching volume and breadth are relatively similar across gender groups, and most differences are not statistically significant.
• There is some evidence of gendered difference in teaching structures. Exploratory analyses hint that cisgender women may receive fewer repeated teaching assignments early in their careers, potentially requiring more new course preparation labour. However, these findings are tentative and should not be overstated.
• Perception of institutional climate differs substantially by gender. Respondents reporting non-normative gender identities and cisgender women consistently reported lower satisfaction with program climate than cisgender men.
• Causation remains uncertain. The survey identifies meaningful statistical patterns, but many possible explanations remain open. Publication and teaching outcomes may also reflect differences in disciplinary specialization, institutional context, postdoctoral trajectories, labour structures, and time-to-hire dynamics that are not fully captured in the present dataset.
NOTES
[1] The Kruskal-Wallis test (also known as the “one-way ANOVA on ranks”) is a non-parametric method used to determine if there are statistically significant differences between three or more independent groups. This test is used to determine statistical significance here because there are more than three independent groups, and the groups have unequal sample sizes.
[2] The Mann-Whitney U test is a non-parametric alternative to the independent samples t-test that does not assume a normal distribution of data. It is employed for testing statistical significance in this section because publication counts are highly skewed by extreme outliers, and the Mann-Whitney U test evaluates the rank-ordering of values to identify systemic shifts in the typical candidate’s record rather than being disproportionately influenced by a small number of “super-producers”.
[3] While the Welch’s t-test used here is designed to handle unequal sample sizes, the smaller number of respondents reporting a non-normative gender identity means that individual outliers in that group have a larger impact on the group’s average.
[4] The ANOVA test (Analysis of Variance) is a statistical method used to determine if there are any statistically significant differences between the means of three or more independent (unrelated) groups. For this analysis, we used a One-Way ANOVA to see if the gender of an academic (the independent variable) had a measurable impact on the number of courses they taught (the dependent variable). The core idea is that if the “Between-group” variance is much larger than the “Within-group” variance, then this would suggest that the groups are actually different and the result is not just due to random chance.
[5] We also performed Welch’s t-tests comparing only cisgender men and women across the three career stages, and found no statistically significant differences, suggesting that within our dataset, the teaching volume and variety for those identifying as cisgender are relatively balanced.

“[T]his gendered publication gap is not a static phenomenon but one that compounds over time.”
Won’t that be pretty much analytic? Most students will have published 0 pieces at the start of their PhD. A difference in publication rates will have to start at 0 and build up over time. Even if it does so at a uniform rate, there will be a sampling time before which it’s not statistically significant.
I take the point, but describing this as “pretty much analytic” presupposes that publication trajectories differ between genders—which is precisely the empirical question we are examining.
If gender groups had identical publication trajectories, their cumulative difference should remain close to zero (aside from random variation). We could also imagine a scenario in which there is no gap during graduate training, a statistically significant gap emerges by graduation, and that gap then narrows by the time of first permanent hire. Alternatively, a gap could emerge early and then remain constant if publication rates converge later in the career trajectory.
The relevant issue is whether publication trajectories diverge over time and whether those differences persist or become more pronounced at key career transitions. Our argument is that the data suggest such divergence.
No real disagreement, but what so meant was: *if* there is a difference in publication between genders, then it’s pretty much analytic that it will develop over time and be statistically insignificant before some point, given the background assumption that people publish over the course of their PhDs and not in a block at start or end. You might want to look at if the difference between ratio of publications as grad students and after graduation is statistically significant; eyeballing it, probably it isn’t.
I wrote a post for PhilosophersCocoon with a hypothesis that gender disparities are significantly driven by motherhood: https://philosopherscocoon.com/2025/04/10/we-should-disaggregate-philosophys-graduate-admissions-placement-tenure-and-promotion-and-publishing/
Since then, this has come out: https://www.nature.com/articles/d41586-026-00981-3
Yes, excellent point. At the same time as the paper you cite a publication came out finding that women tend to favor quality over quantity in publication (“our research suggests that female and male researchers navigate the productivity-prestige landscape differently, yet ultimately attain comparable journal impact despite persistent productivity gaps.”), which they see as possibly explained by caregiving responsibilities (“female researchers often bear a disproportionate share of caregiving and domestic responsibilities…the tendency for female scholars to occupy regions of the productivity-prestige plane that prioritize average journal impact over volume may reflect a necessary optimization under time constraints”). This adds to prior work finding that numerical gaps in publication/citation counts for women can be explained by social/network effects (not productivity) and that there is dramatic “market correction” for women (but not men) who are eventually awarded elite status. As Travis writes, we don’t yet know what explains the difference in philosophy, but these are all helpful leads.
This is interesting. Is there continuing research by APDA on motherhood/parenthood? I especially wonder about the percentage of mothers in philosophy versus other occupations, and versus the population as a whole.
No, we haven’t added questions about that. But I will add it to topics for us to discuss before the 2027 survey.
I wonder whether there is a version of this report on skin colour or race or on whether English is a second language.
Yes! Although not included in the Daily Nous version of the post, the original write up on the APDA blog ends with the following statement:
There are currently some other posts planned for July and August, but the next in this specific series should be available sometime near the end of summer. So, keep an eye out for more data analysis forthcoming!
“These findings suggest that perceptions of institutional climate and belonging vary substantially across gender groups, even where objective career outcomes partially converge later in the pipeline.”
Given the publishing stats show large STDs and heavy tails, and given many grad students don’t get academic jobs, it seems like there’s a principled basis for thinking that there’s importantly different subgroups here e.g. perhaps the ciswomen who get jobs were already more similar to the men who got jobs in various ways, which would be evidenced by them e.g. giving similar climate ratings during grad school. Rather than ‘women perceive climates to be less welcoming but then more welcoming as they go down the pipeline’ if we saw this it would mean the results should be read as ‘the type of people who are probably going to succeed find it similarly welcoming at both points’.
Also it’s been shared before but I still find this paper an important resource for putting these kinds of findings winin a broader context of what we do and do not have data supporting vis. academic bias and advantages: https://journals.sagepub.com/doi/full/10.1177/15291006231163179
Ed Teach,
thanks for the reference.
For those who have not yet read it, the paper Ed Teach links to is very important. It is eye opening, discussing data from many studies, from 2000 to 2020. It should be the starting point for further discussions.
If you take all men and all women who graduate, regardless of whether they go on to secure permanent academic roles, are there still differences in publication experience at graduation? What about X number of years out from receiving a PhD? In the 2025 survey, there are twice as many men as women in the pool of respondents (65% vs. 31%) and less than half of graduates had secured permanent academic roles, so there’s a large funneling effect among the people you’re looking at who have permanent academic roles. An earlier post noted that “Graduates who secure permanent academic roles report higher average publication counts (mean = 2.62, median = 2) than those in contingent roles (mean = 1.48, median = 1) or non-academic careers (mean = 0.78, median = 0)”. Looking at differences in the overall population seems at least as relevant for comparing publication productivity as focusing on number of publications at permanent hiring, since the at hiring number depends a lot on the pathway (i.e. someone hired straight out of a graduate program vs. someone hired after 5 years of temporary positions). Differences at permanent hiring might be affected by philosophy’s system of publishing, but they might come as much or more from selection effects in hiring. Even if hiring committees don’t put more weight on publications in the case of male candidates, the larger pool of men might lead to differences e.g. say there are 200 men and 100 women candidates and the top 20 men and women in productivity are hired, the median publication count would likely end up higher for men even if both men and women are equally productive on average.
While this is an APA survey so I assume most of the respondents are US-based, I wonder if there is a significant difference between the US and the European pathways. If one doesn’t get a permanent job after graduation in the US, one likely ends up in a teaching-heavy temporary position, where publishing is rather difficult. If one doesn’t get a permanent job after graduation in Europe, one likely ends up with a postdoc, which is research only. For various reasons, I’ve been in both situations – in the US, teaching a 4-4 as a new PhD, I published less than I do now; as a European postdoc, I published (much) more. (I’m a woman in a UK-based permanent post.) It would be interesting to see whether this has any effect on the overall statistical data.
Hi there. This is not an APA survey. It is a survey by the Academic Philosophy Data & Analysis (APDA) project which is independent from APA (though has received funding from them in the past). The survey goes to people who graduate from English-speaking institutions. We still anticipate a bit of US over-representation, but hopefully not as much as an APA survey.
Because the survey is anonymous, we don’t actually gather data about where the respondent works, which makes the NA/Europe comparison difficult. This is compounded by the fact that (1) different European locations probably have different norms too, and (2) there are also a number of institutions included that are outside of NA/Europe, making the kind of cross-geographic analysis difficult. We do agree that what you suggest is an important line of inquiry and we’ve talked a few times about how we might probe it. Hopefully we can figure out a way that is feasible without compromising anonymity in the future.