
New Data about Philosophy Graduate Programs (guest post)
In the following guest post, Carolyn Dicey Jennings, associate professor of philosophy at UC Merced, shares some new data about graduate programs in philosophy that she and her team at Academic Philosophy Data and Analysis (APDA) have collected and analyzed.

New Data about Philosophy Graduate Programs
by Carolyn Dicey Jennings
Academic Philosophy Data and Analysis (APDA) has been running in some form since late 2011. It collects and analyzes data about academic philosophy, with a special focus on PhD graduates and their employment outcomes. Its blog, which has been running since 2017, has had tens of thousands of visitors, and its most popular post is Best PhD Programs in Philosophy. This is an update to that post, based on this year’s data collection efforts.
An important caveat: this is not a ranking of PhD programs. I have been engaged in public conversations about rankings in philosophy for years now and have come to the conclusion that it is more useful to have sortable lists based on different criteria. The table on the homepage of APDA’s website is intended to provide just that. The table is currently sorted by overall student rating (for graduates 2012 and later), but can be sorted instead by average student rating of the program’s climate, teaching preparation, research preparation, financial support, the number of total 2012-2021 graduates, permanent academic placement rate for those graduates, placement rate into PhD-granting programs, temporary academic jobs, nonacademic jobs, or the primary nonacademic sectors for these graduates. This data can be examined in more detail by clicking on the name of each program.
Ok, so which programs are the best? I will focus in this post on two metrics: student ratings and employment, ending the post with some comments on overall employment trends. (Below, “*” is used to indicate programs that show up on both lists.)
Student Ratings
Let’s start with the programs that have the highest recommendation from their graduate students, focusing on current students and graduates from 2012 and later. These are divided by topical cluster. In a paper forthcoming in Metaphilosophy, Pablo Contreras Kallens, Dan Hicks, and I describe the method of clustering programs:
In machine learning, cluster analysis is any method that arranges units of analysis into subsets, i.e. clusters, based on some measure of similarity between the variables that characterize them (James, Witten, Hastie, & Tibshirani 2013, 10.3). In the current project, the units of analysis are philosophy PhD programs, and the variables that characterize them are aggregated from (1) the areas of specialization (AOS) of their PhD graduates and (2) the ‘keyword’ survey responses.
For this post I will use just three clusters, which were the best supported in our research: 1) analytic philosophy, 2) philosophy of science, and 3) historical, continental, and applied philosophy.
The following programs were given an average rating of “definitely would recommend”:
Analytic Philosophy
Rutgers University* (n=26; 4.73)
Massachusetts Institute of Technology* (n=19; 4.70)
Australian National University (n=20; 4.69)
University of Illinois at Chicago (n=6; 4.67)
University of North Carolina at Chapel Hill* (n=30; 4.65)
University of California, Berkeley (n=20; 4.60)
University of Southern California* (n=15; 4.60)
Yale University* (n=18; 4.53)
University of Michigan* (n=18; 4.50)
Philosophy of Science
Carnegie Mellon University (n=11; 4.55)
University of Cambridge, HPS (n=7; 4.50)
Historical, Continental, and Applied philosophy
University of California, Riverside* (n=14; 4.68)
The Catholic University of America* (n=6; 4.67)
Saint Louis University (n=5; 4.60)
Some of these also show up with “very satisfied” ratings in the other domains, such as:
climate – Rutgers, ANU, CUA (other universities with “very satisfied” ratings in climate are Rice, Sheffield, KCL, St Andrews/Stirling, UConn, and UVA);
preparation for research – USC, Rutgers, MIT, Riverside (other universities with this rating include Pittsburgh HPS, Bowling Green, UCLA, Cornell, UPenn, Irvine LPS, Toronto, and Penn State)
financial support – USC and Yale (other universities with this rating include Emory, Notre Dame, NYU, Baylor, Vanderbilt, Rice, and Pittsburgh).
Unfortunately, none of these programs have average ratings of “very satisfied” on preparation for teaching, but programs that do have this rating are: Kansas, Villanova, Bowling Green, Baylor, Georgetown, Fordham, and University of Washington.
Employment
Permanent academic placement rate just means the proportion of graduates whose most recent employment is in a permanent academic job. Because most graduates (around 90%) prefer academic employment, and because permanent academic employment is preferred over temporary employment, this metric is the standard for our project as a measure of successful placement. Beginning with this measure, then, the following programs have permanent academic placement rates that are at least one standard deviation above the mean:
Analytic Philosophy
Yale University* (52 graduates; 71%)
University of Southern California* (49 graduates; 69%)
University of Virginia (38 graduates; 61%)
Massachusetts Institute of Technology* (45 graduates; 60%)
University of Florida (5 graduates; 60%)
University of Michigan* (47 graduates; 60%)
New York University (54 graduates; 59%)
Harvard University (54 graduates; 56%)
Rutgers University* (63 graduates; 54%)
University of North Carolina at Chapel Hill* (56 graduates; 54%)
Philosophy of Science
University of Cincinnati (16 graduates; 69%)
University of California, Irvine LPS (24 graduates; 54%)
University of Pittsburgh, HPS (39 graduates; 54%)
Historical, Continental, and Applied philosophy
Baylor University (41 graduates; 63%)
Vanderbilt University (40 graduates; 63%)
Boston University (40 graduates; 58%)
University of Oregon (37 graduates; 57%)
University of California, Riverside* (30 graduates; 57%)
The Catholic University of America* (65 graduates; 55%)
Pennsylvania State University (50 graduates; 54%)
Many of these programs are also at least one standard deviation above the mean for permanent placement into PhD-granting programs (Irvine LPS, Yale, MIT, NYU, Michigan, Pittsburgh HPS, Harvard, Rutgers, and Penn State; other programs not on this list that have this quality include Cambridge HPS, Salzburg, Berkeley, Chicago CHSS, Carnegie Mellon, Princeton, Stanford, Oxford, LSE, Arizona, Cambridge, and Wash U).
Finally, nearly 20 programs are at least one standard deviation above the mean proportion of graduates with nonacademic employment, with proportion and primary nonacademic sectors listed:
University of Waterloo (43%: health; consultancy; education)
University of Guelph (41%: consultancy; arts; publishing)
University of California, Santa Cruz (41%: arts; consultancy)
Victoria University of Wellington (38%)
The University of Melbourne (36%: government; education)
University of Iowa (36%)
Fordham University (36%: education; tech; religion)
University of Otago (33%: education; government)
University of Rochester (32%: tech)
Western University (30%: consultancy; education; health; government; arts; publishing)
Brown University (30%: education; tech; law; consultancy)
Florida State University (30%: health; government; consultancy)
University of Dallas (29%: religion)
University of Arkansas (29%)
University of Kentucky (29%: education)
University of Toronto, IHST (27%: government)
University of Georgia (27%: education; non-profit/NGO)
University of Kansas (27%: tech; education; non-profit/NGO)
Georgetown University (26%: education; government; non-profit/NGO; tech; health)
Overall Trends
As reported at APDA, we can get a bird’s eye view of employment trends through a Sankey chart, with the number of graduates in different categories on the left, and the number of graduates employed in different types of jobs on the right. In this case graduates are split into three groups depending on the permanent academic placement rate of their PhD program, with those in programs of the highest placement rates in Group 1, middle rates in Group 2, and lowest rates in Group 3.
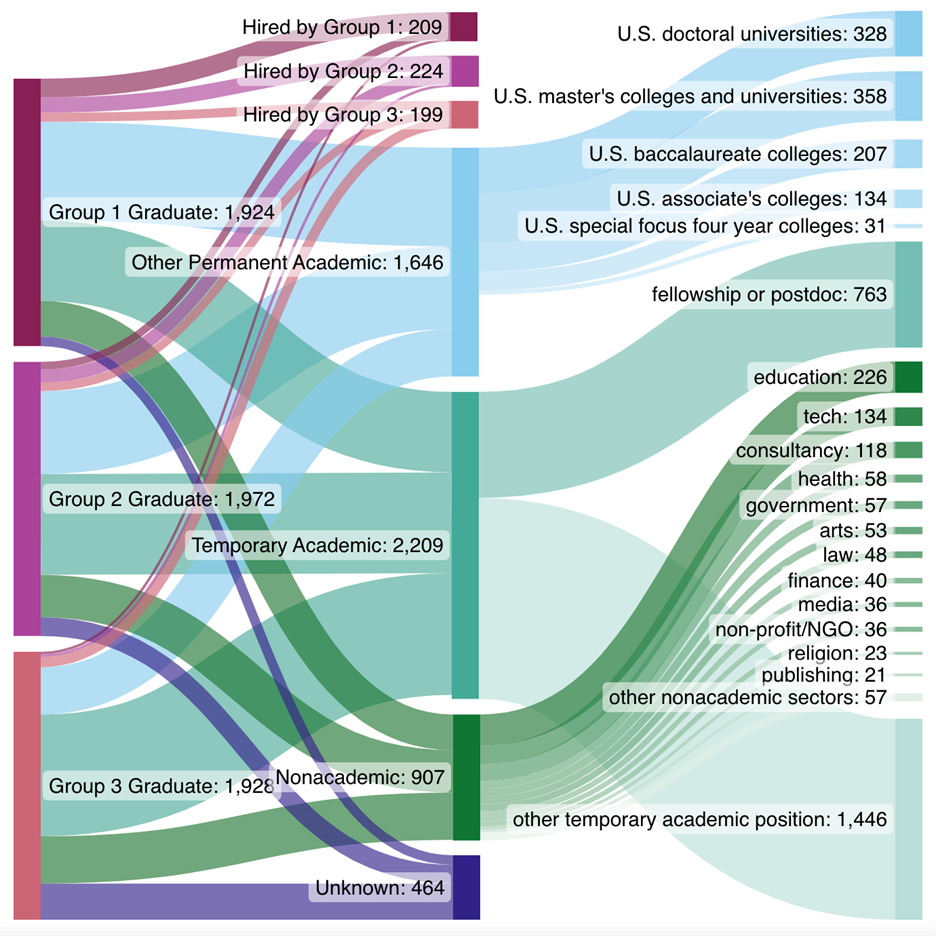
Comparing the thickness of the bars connecting the left to the right, you can see that Group 1 prefers hiring from Group 1 over Group 2 and 3, and that Group 2 prefers hiring from either Group 1 or 2 over Group 3. This may reflect the prestige bias reported by De Cruz (2018) and in Contreras Kallens, Hicks, and Jennings (forthcoming):
we used two separate methods to establish that prestige plays an important role in the hiring of job candidates into philosophy PhD programs, finding a significant gap in prestige between those graduate programs that hire from all other programs (low-prestige) and those graduate programs that tend to only hire from a select group.
The chart also gives a better sense of where all other graduates are employed, with the largest group in temporary academic positions that are not fellowships or postdocs.
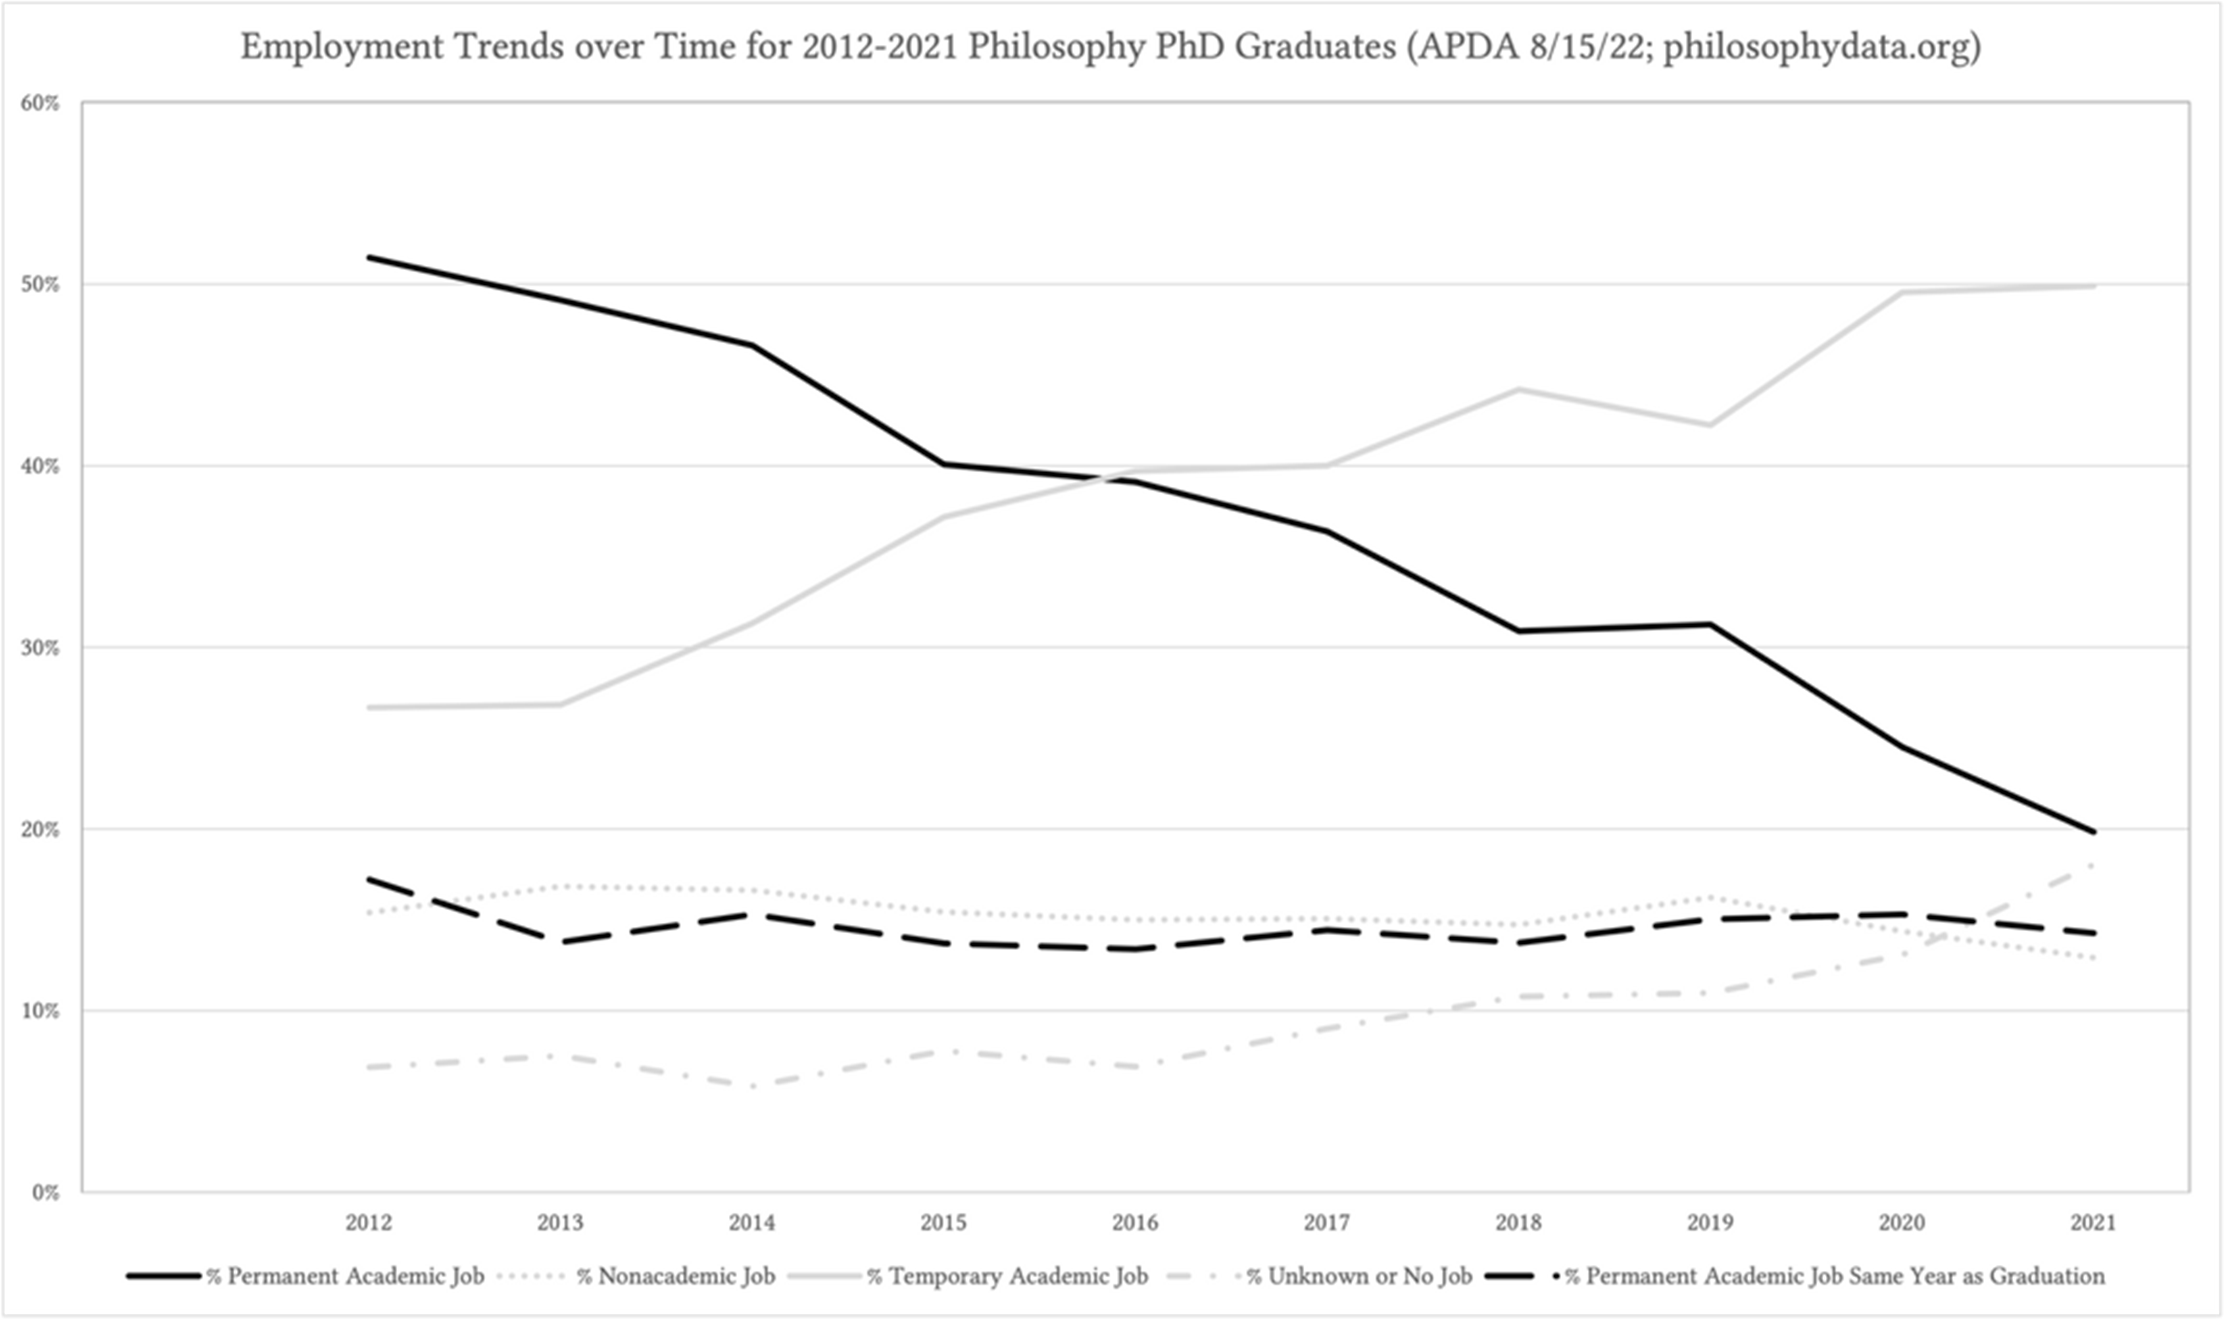
Finally, as reported in Jennings and Dayer (2022), the proportion who find permanent academic jobs in their first year post-graduation does not seem to have changed in the pandemic and associated recession, as can be seen with the black dashed line in the graph below. That is, whereas the permanent academic placement rate does drop for more recent graduates, this is largely because it takes time for most graduates to find this type of position—recent graduates have had less time, and so are less likely to have a permanent academic placement. In contrast, there is no drop off when we focus on those graduates who found a permanent academic position in the same year they graduated. This indicates that the proportion of those finding permanent academic jobs has held steady, at least for those who find such jobs relatively quickly.
If we look at the first-listed areas of specialization for those 2012-2021 graduates in permanent academic employment, only three areas are at least one standard deviation above the mean permanent academic placement rate for all AOS’s: Comparative (9 graduates; 89%), Asian (38 graduates; 68%), and American (including Latin American: 31 graduates; 52%). Another three are one standard deviation below the mean: Economics (15 graduates; 27%), Aesthetics (153 graduates; 25%), and Action (69 graduates; 25%).
Trends are difficult to assess. I used indexed placement rates for each AOS, such that the placement rate of a specific AOS in a specific year is divided by the placement rate for all AOS’s that year. Using linear regression over these values reveals that some AOS’s have a positive slope over this time period: Technology, Asian, Aesthetics, Medieval/Renaissance, Biology including Environmental, Social/Political, Gender/Race/Sexuality/Disability Studies, Metaphysics, and Math have a 3% or greater slope for those years with at least 5 graduates. Other AOS’s have a negative slope: Action, Mind, Law, American including Latin American, Logic, Ethics, Epistemology, Applied Ethics including Bio and Medical, Value General, Meta-Ethics, and Decision Theory have a -3% or less slope for those years with at least 5 graduates. But this should be taken with a grain of salt since the limitation of 5 graduates leads to gaps in the data. Technology, for instance, has the highest slope but only three years worth of data (.36, 1.19, and 1.64 for 2018, 2019, and 2020), whereas Decision Theory has the lowest slope but only two years worth (1.15 in 2016 and 0.64 in 2019).
If you have ideas for how the project can improve, or other studies we should run, we would love to hear from you in the comments or over email: [email protected].

“Group 1 [of three groups individuated by overall placement rate] prefers hiring from Group 1 over Group 2 and 3, and that Group 2 prefers hiring from either Group 1 or 2 over Group 3. This may reflect the prestige bias reported by De Cruz (2018) and in Contreras Kallens, Hicks, and Jennings (forthcoming)”
It might. But it’s also exactly what would be expected if the higher placement rate of group 1 over group 2, and of group 2 over group 3, just reflects the fact that group 1 graduates are in general stronger applicants than group 2, who are in general stronger applicants than group 3, and if job applicants in general prefer being at departments with stronger graduate programs.
Not at the level observed. Group 1 hires *7 times* as many graduates from Group 1 as Group 3, and their mean permanent academic placement is only double that of Group 3 (52% vs 22%); Group 2 hires *6 times* as many from Group 1 or 2 than 3, and likewise only had about double the placement rate: https://apda.ghost.io/2022-data-collection-results/
Can you quantify why those ratios are incompatible with my suggestion? It’s not obvious to me. I don’t see any simple argument as to why those ratios should be equal, especially since a large fraction of placement is to non-graduate-degree-awarding schools. (Your joint-authored paper you cite is more neutral on the subject, saying only that the difference “should not necessarily be interpreted as a measure of merit or quality, at either the program or individual level” – emphasis mine – which I agree with.)
If the argument is simply that there is a hidden quality picked up by hiring committees that distinguishes these graduates, we would expect parity, or near parity, with the mean placement rates (could focus on placement rates into PhD granting programs, but the differences are about the same: 16% Group 1, 13% Group 2, 7% Group 3). If there is some further hidden quality not picked up by hiring committees overall, it would be mysterious why it is apparently detected only by some PhD granting programs. That is, Group 3 treats the groups equally when it comes to hiring. Group 2 treats itself and Group 1 equally. How could this be explained by a hidden quality variable, especially given the more than adequate pool of available graduates?
“If there is some further hidden quality not picked up by hiring committees overall, it would be mysterious why it is apparently detected only by some PhD granting programs. That is, Group 3 treats the groups equally when it comes to hiring. Group 2 treats itself and Group 1 equally. How could this be explained by a hidden quality variable, especially given the more than adequate pool of available graduates?”
This just follows from the hypothesis that applicants prefer stronger-ranked programs. Group 3 is bound to treat applicants from the groups more equably than group 1, because the strongest candidates have already been offered jobs by groups 1 and 2 and – ex hypothesi – they come disproportionately from groups 1 and 2 (and within that, disproportionately from group 1). The pool of people who will accept a group 3 job (again, ex hypothesi) is less unevenly distributed than the original pool.
Put another way: on the alternative hypothesis it’s not that there is some “hidden quality not picked up by hiring committees overall”, it’s that higher-ranked departments are better placed (at the tail) to act on quality, since they have more of a pick of candidates.
I think this would only be consistent in a model where very few candidates are considered strong enough for graduate teaching and related research. The majority of graduates from every program, and more than 80% of PhD graduates from Group 1 programs, are not placed at PhD-granting institutions. So there isn’t really a shortage of graduates for the programs in Group 3. If they wanted to focus on Group 1 graduates to the same extent as Group 1, they certainly could.
My model is that, sure, there may be quality differences to applicants at more prestigious programs as well as to graduates of those programs, but that it isn’t plausible that this is a difference of 7-fold. This means prestige bias, a well documented and common to all humans cognitive bias, is also playing a role in philosophy. This is not surprising. Heck, it may even be rational: so long as you know that most people value prestige for its own sake, it makes sense to value prestige. If you are a prestigious institution, you have a lot to lose by hiring someone with a non-prestigious pedigree in a world where prestige is highly valued for its own sake. You would need that person to be better than someone from a high prestige program in order to want to take that risk—the risk that your program will be devalued in the eyes of others simply due to the existence of a person in the program without the right pedigree. But this is not about scholarship or the search for truth or philosophical quality. That is the point here.
In sum: I don’t think a 7-fold difference in graduate quality between these programs is plausible on its face, and I don’t think it is the most reasonable interpretation of this evidence.
There’s not much I have to say that I haven’t already said but I do want to flag two things:
“ in Group 3. If they wanted to focus on Group 1 graduates to the same extent as Group 1, they certainly could.”
This (and some of your earlier comments) implies a bimodal model of hiring where one filters out insufficiently-strong candidates and then selects discretionally from the rest. This doesn’t match my experience of hiring: it’s routine for thoroughly-appointable candidates to be crowded out by clearly-stronger candidates.
“My model is that, sure, there may be quality differences to applicants at more prestigious programs as well as to graduates of those programs, but that it isn’t plausible that this is a difference of 7-fold.”
This isn’t a model: it’s a hunch about plausibility; an intuition, if you like. “It isn’t plausible that X” is not an argument for not-X.
How can the overtly demonstrable implausibility of any x NOT be an argument for ~x?
If you can *demonstrate* that X is implausible, sure. But Professor Jennings doesn’t demonstrate or claim to demonstrate it – she simply says that her model is that it’s implausible.
It’s also perhaps worth pointing out that for A to be 7x better than B at placing its students than B, they don’t have to be 7x better – they just have to be fairly consistently somewhat better.
But there doesn’t have to be a 7-fold difference in quality to justify a 7-fold difference in choice! These things often come apart in competitive markets.
I go to Breakaway Cafe about 10 times as often as the competitor, but only because it’s closer, and I slightly prefer the short walk.
Taylor Swift gets billions of times more streams than most artists, many of whom are not billions of times worse.
Etc.
So I don’t think this post does much to establish prestige bias, and I think you should just say that prestige bias is consistent with your data, not established by them.
I should also note a competing explanation: verification! If Group A programs are known to be good, they can verify the quality of their candidates more persuasively. This raises the expected value of Group A’s candidates without assuming that prestige itself is part of their value. (Akerlof talks about this sort of thing in “The Market for Lemons,” IIIB.)
A separate comment: in earlier iterations of this (I should say, very valuable and much appreciated) project, I suggested imposing a (say) 5-year cutoff and looking at placements after the cutoff (so that the last cohort examined would be the 2017 cohort). I’d like to repeat that suggestion, now that the baseline of collected data is longer. As it is, recent cohorts are going to have less good permanent placement records because they’re still cycling through postfix’s and the like (and so the decrease in permanent placements for the last few years will be somewhat artefactual). This will also matter for comparing US and non-US placement since non-US applicants probably do post docs more.
I, too, would find it illuminating to see data on PhD graduates who completed their studies 5+years ago. As a PhD student at a British programme, I find it alarming that British programmes consistently perform so poorly relative to American programmes on the APDA’s “Permanent Academic” and “PhD Permanent Academic” metrics. I suspect that this might be (at least in part) explained by the greater tendency of graduates from British PhD programmes to go through a number of postdocs before landing a permanent position. Imposing a 5-year cutoff would, as you say, go some way towards accounting for this difference.
Anecdotally I’m fairly sure that’s right. It’s also the case that since UK permanent positions don’t really have the same tenure-track process, there is somewhat more expectation that you’re not hiring straight out of grad school – especially given grad school is a somewhat shorter process in the US.
It’s also worth noting that the APDA data doesn’t directly say anything about the success rate of UK graduates on the US job market. The philosophy job market is very internationalized but not wholly so, and many people are reluctant to change continent and don’t apply, or mostly don’t apply, from Europe to the US or vice versa. If (a) the UK job market is less good than the US one; (b) some significant fraction of UK graduates don’t compete on the US job market and vice versa, then overall placement would be worse for UK programs even if UK graduates do as well as US graduates on the US job market.
If I do that (restrict to 2012-2017 grads) and then sort by permanent academic placement rate, top UK program is Cambridge HPS at #40 (56%), next Oxford at #47 (54%), with 44% the overall rate. That is a bit better than #48 and #60 for the data in the current table, but I am not sure that is worth the loss of information about recent graduates. (There is another UK program that trumps both in the current table, but it hasn’t been certified by a program representative: Trinity College Dublin is currently at #10.)
If I restrict to jobs in PhD-granting programs, Cambridge HPS and LSE actually do a bit worse than in current table (#3 to #6; #17 to #23), while Oxford and Cambridge do a bit better (#16 to #14; #19 to #13); cutting off five years of data not clearly helpful for UK programs on this measure.
That’s very interesting indeed. Thank you for sharing!
Ireland is not part of the UK…
Any chance you could make the anonymized placement data published on the APDA website available in spreadsheet or CSV form? (The bit under the ‘Data’ section on the website.) It would be great if other people could run their own analyses of it. I quite appreciate you can’t casually share the underlying dataset on privacy grounds, but the placement data is already on the public website, just not very conveniently formatted for bulk analysis – someone with sufficient patience or sufficient skill at web browser automation (I lack either) could already download it all.
There is no easy way to do this, unfortunately, as it would need to be connected to the live database. You can of course scrape the raw data and download the compiled data from the table. It is on my wish list to have an auto generated csv, and has been for tests, but the people who work on this side of the project are swamped with other, more pressing technical needs and we have little to no funding for the project at the moment.
Tests=years
Fair enough, thanks for the quick reply.