
Guide to Graduate Programs in Philosophy Based on Job Placement and Student Experience (guest post)
Academic Placement Data and Analysis (APDA) is a resource for prospective philosophy graduate students and others to learn about how well particular graduate programs do with getting their graduates jobs, and what it is like to be a student in those programs.
In the following guest post*, the creator of APDA, Carolyn Dicey Jennings, describes some recent and forthcoming updates to it.

[Julie Cockburn, “Quizitive” (detail)]
A Guide to Graduate Programs in Philosophy
Based on Job Placement and Student Experience
by Carolyn Dicey Jennings
We are nearing the 10-year anniversary of the start of the APDA project: Academic Placement Data and Analysis began as an Excel spreadsheet in December 2011, when I was trying to figure out placement trends my first time on the job market. I had heard all kinds of anecdotes and stories, but I wanted facts. What proportion of candidates get permanent academic jobs? What kinds of people are more likely to get these jobs? I have worked with numerous other people over the years to find answers to these and connected questions about academic philosophy. I am currently finishing up a report on this year’s findings with a graduate student, Alex Dayer, under the advice of our board of advisors. We plan to send that report out for publication in the next month, with some more blog posts along the way. In this post I provide some of the findings on job placement and student ratings.
First, a little background: APDA collects information about those who graduate with a PhD in philosophy and their subsequent job placement using both public sources of information and input from placement directors and the graduates themselves. We work with the oversight of UC Merced’s IRB, and all those with access to the data have research ethics training. Our database has information on approximately 14,000 PhD graduates and current students, primarily for the years 2011-2021. In late July we sent out a survey to around 10,000 of those students and graduates (all those for whom we had an email address on file) and around 1,000 participants took part. Our findings are a result of data gathering efforts over the summer as well as these survey responses.
Given the pandemic and its effects on the job market, one thing you might be wondering is whether students are less likely to recommend their graduate programs now. We did not find this to be the case. Students were “somewhat likely” to recommend their programs in 2018, and the same is true for 2021. Moreover, this average is the same for those participants who graduated prior to 2018, post 2018, and who are now current students.
If we combine student recommendations for the 2021 survey and the previous survey, we have information for 125 programs, each with 5 or more survey participants.* Their average ratings are here, along with the number of participants and keywords selected by participants to describe the program.
According to this metric, the top ten rated programs are (in alphabetical order): Australian National University (4.8), Carnegie Mellon University (4.6), Massachusetts Institute of Technology (4.7), Rutgers University (4.7), Saint Louis University (4.7), University of California Berkeley (4.7), University of California Irvine (LPS; 4.6), University of California Riverside (4.8), University of Southern California (4.6), and Uppsala University (5.0). The bottom ten are (in alphabetical order): DePaul University (3.3), Johns Hopkins University (3.2), Marquette University (3.2), McGill University (3.3), Southern Illinois University (3.2), Temple University (2.4), University of Georgia (2.8), University of Guelph (2.8), University of Illinois at Urbana-Champaign (2.7), and University of Kansas (3.2).**
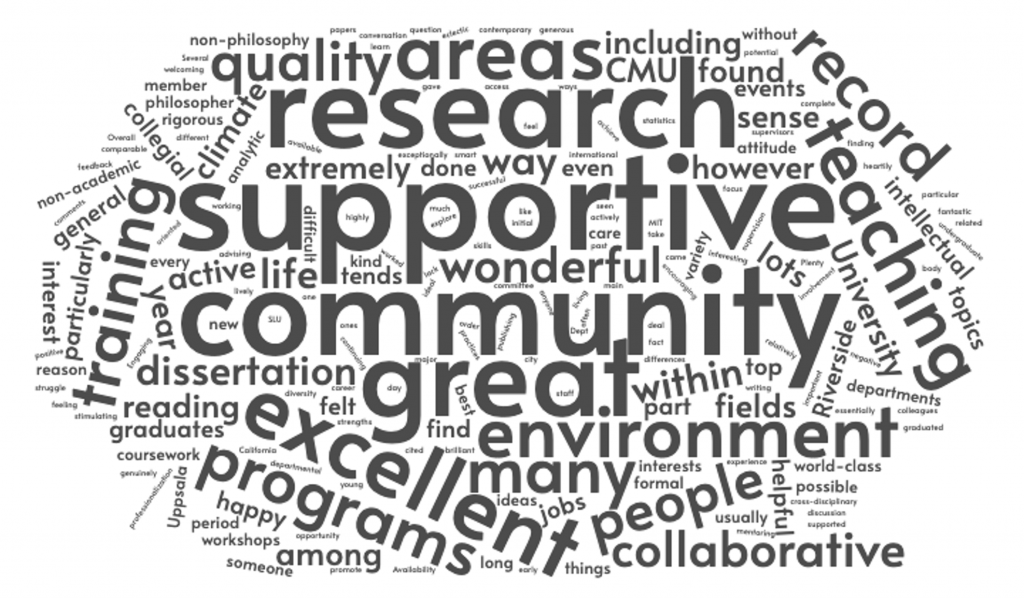
In order to see the contrast in public comments from current students and graduates for these two groups, I created a word cloud for all words used by at least 2 participants from the top 10 programs but not also used by any participants from the bottom 10 programs:
Here is a randomly selected public comment from someone at one of the top ten programs (in terms of overall rating):
1. The climate is very good. 2. People are always around the department. 3. There are lots of reading groups and workshops etc—lots of opportunities to present your work. 4. Faculty are excellent and most clearly care a lot about graduate education. 5. The graduate students are in general very good. This pushes you to become a better philosopher.
And here’s one from someone at one of the bottom ten (in terms of overall rating):
The number of professors and resources have decreased since I attended. The hobbling of the Dewey Center is especially troubling. Further, the funding situation for graduate students is abysmal.
You might have noticed that the programs that receive high recommendations are noted for their community and support. I have been wondering what leads to this sense of community, and so this year we decided to ask participants about their satisfaction with their program’s efforts to foster a healthy, respectful academic culture or climate. Coding these responses from 1 for very unsatisfied to 5 for very satisfied, the mean response is 3.8 out of 5.
The top ten programs for climate rating were (in alphabetical order): Australian National University (4.5), London School of Economics and Political Science (4.5), Saint Louis University (4.5), St Andrews and Stirling Graduate Programme in Philosophy (4.6), Stanford University (4.5), The Catholic University of America (4.6), University at Buffalo (4.6) , University of Sheffield (4.6), Uppsala University (5.0), and Rice University (5.0). The bottom ten are (again, in alphabetical order): Katholieke Universiteit Leuven (3.2), McGill University (3.2), McMaster University (3.3), Princeton University (3.3), Southern Illinois University (3.0), University of Chicago (2.8), University of Missouri (3.2), University of Texas at Austin (3.3), Western University (2.6), and York University (3.3).
The top used word in the public comments exclusively used by those from top 10 programs was “encouraging,” whereas the top word used exclusively by those from the bottom 10 programs was “white.”
Here’s a randomly selected public comment from someone at a top 10 program (in terms of climate rating):
Socialisation between grad students, postdocs and permanent faculty is heavily encouraged. Grad students are treated as equals and as individuals with academic projects, not just lowly staff. Many social events and para-professional social situations are offered to help everyone fit in. In addition, there are dedicated grad-student-only seminars and conferences to enable students to practice and participate in a lower-stakes environment.
And here’s one from a bottom 10 program (in terms of climate rating):
There was dissent within the department that was not merely philosophical differences, but sometimes a lack of mutual respect. Grad students were discouraged from teaching at the College (diploma) level and were told that teaching experience would not increase the likelihood of an academic career. At least 2 of the faculty union strikes highlighted the rifts between fulltime faculty and part-time faculty & Teaching Assistants. There was also a lack of diversity in the department that hindered the creation of an inclusive community.
We intend to analyze the public and non-public comments over the next year to see if we can find trends in these responses.
Finally, a brief report on academic job placement. We looked at 6641 graduates between 2011 and 2021, 2606 of whom are now in permanent academic jobs, and 901 of whom are now in non-academic jobs. Thus, excluding those in non-academic jobs, 45% of the graduates from this time period are in permanent academic jobs. The remaining graduates are either in temporary academic jobs or have no employment on record. Narrowing this down to just those 131 programs for which we were able to collect and check data in 2021 (excluding those with no accessible placement page or dissertation records), the numbers are slightly improved, with 47% now in permanent academic positions. (We will release program-specific placement rates with the published report.)
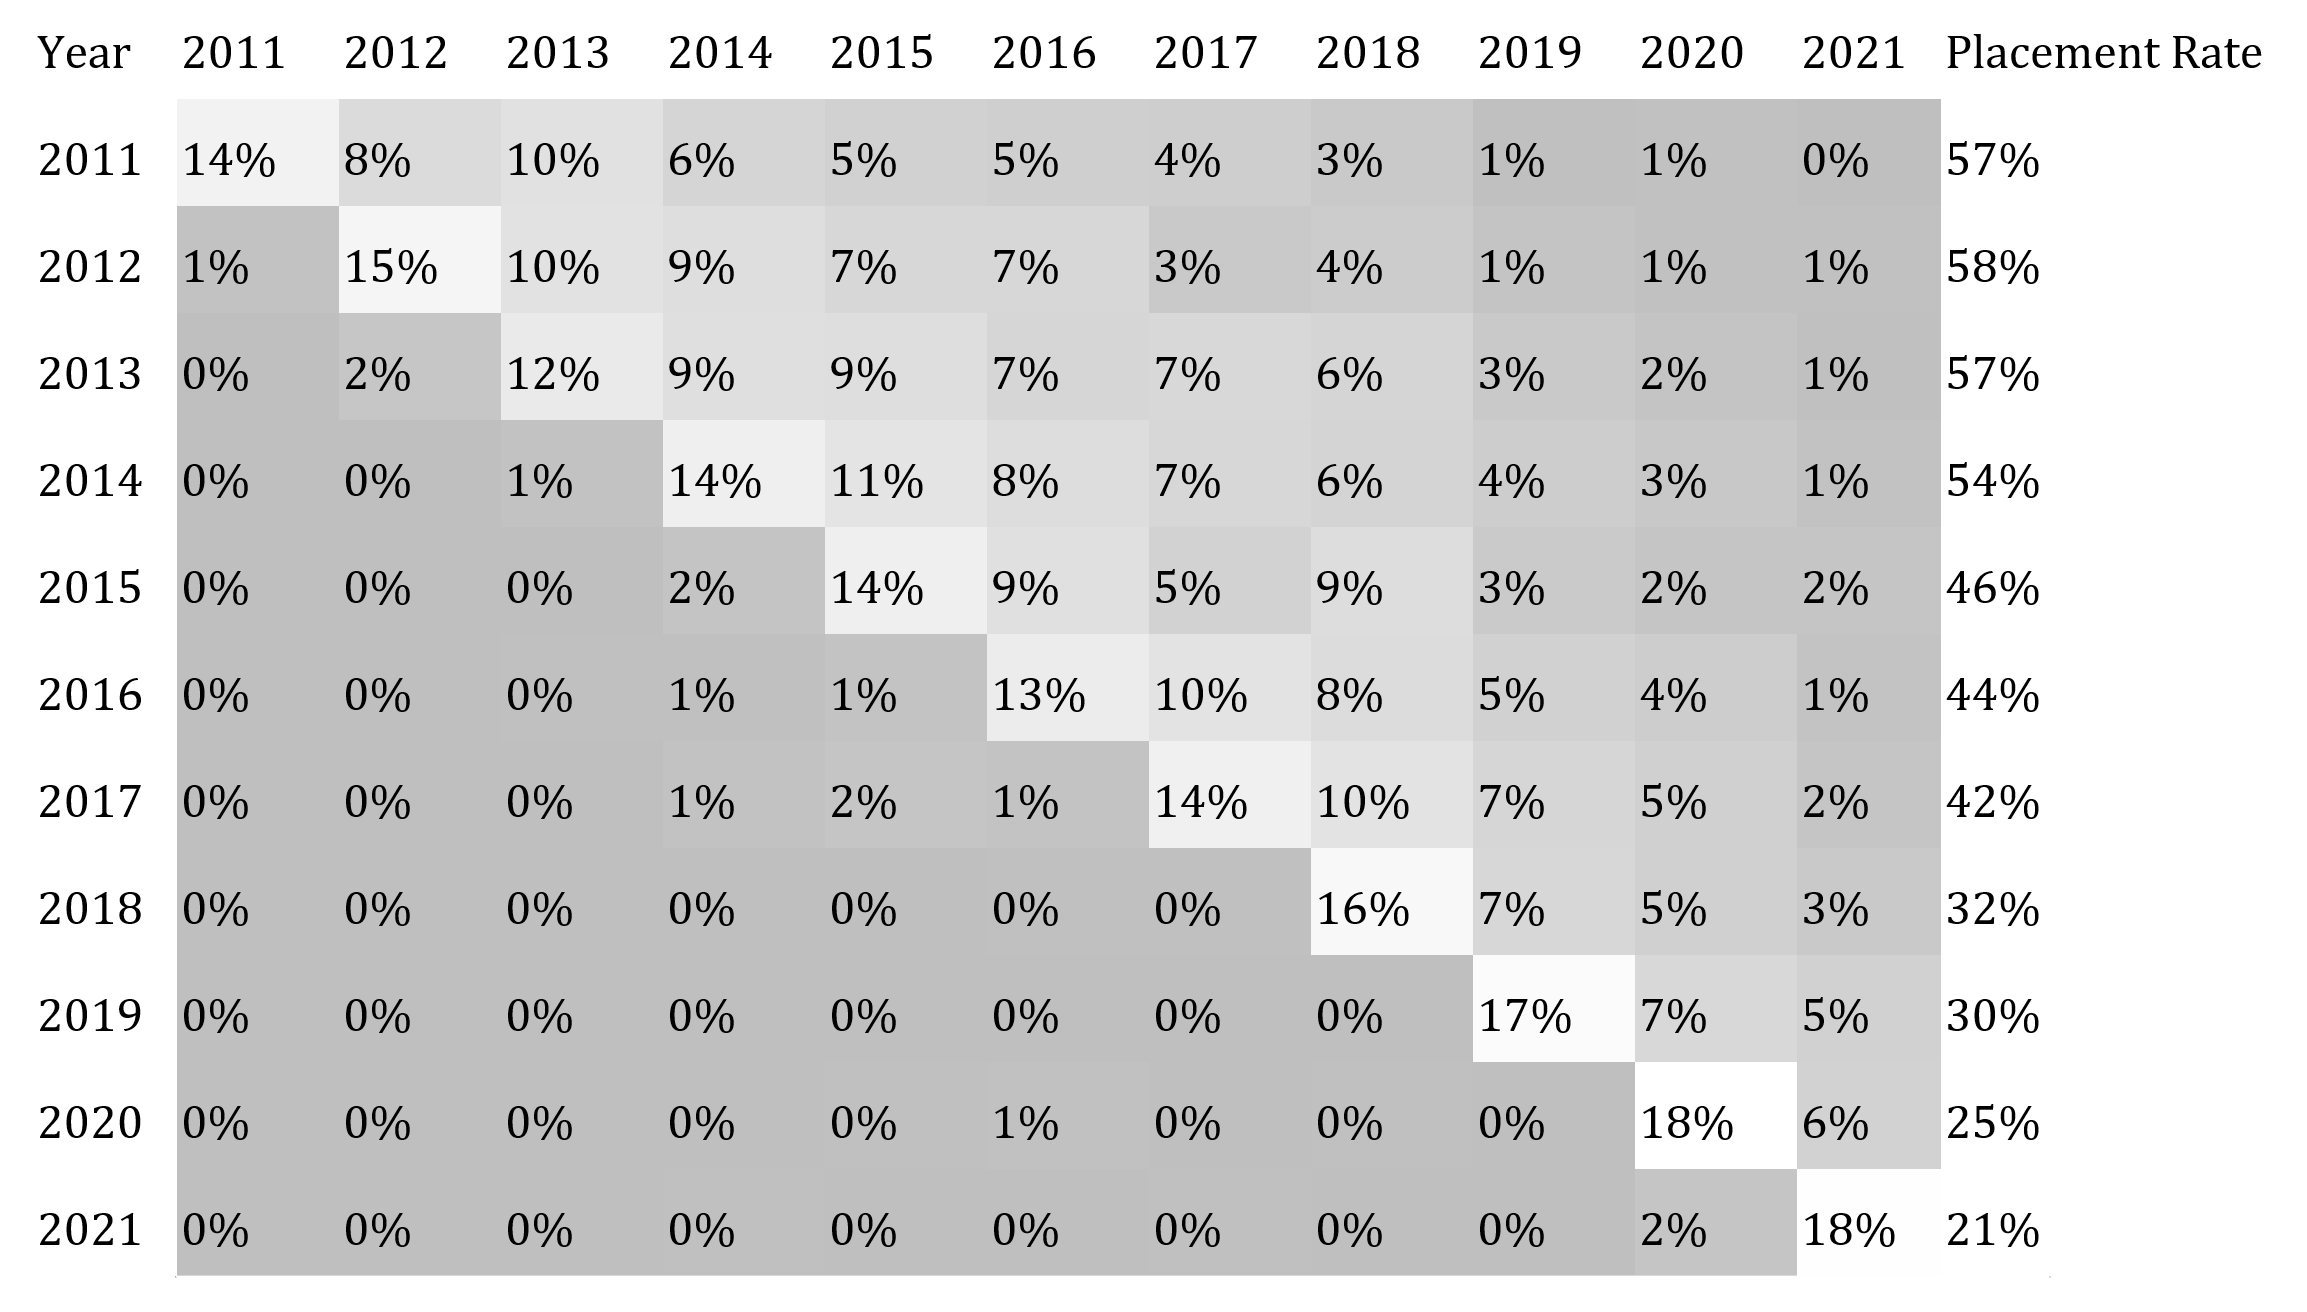
Breaking this down by graduation year, 57% of 2011 PhD graduates are now in permanent academic jobs, whereas only 25% of 2021 graduates are. Of course, 2021 graduates have had far less time to find jobs. In the graph below we charted placement rates according to both graduation year (y-axis) and placement year (x-axis). For example, those 2011 graduates who found a permanent academic job in 2011 are divided by the total number of 2011 graduates minus those who are now in non-academic jobs to yield a placement rate of 14% (top left corner). In contrast, 8% of those who graduated in 2011 found permanent academic placement in 2012. The cells are shaded white if they have higher numbers, and gray if they have lower numbers. It is clear that the highest proportion of graduates each year are placed in their first year out, and that this proportion has not reduced over time. (Yay!)
Comparing placement rates across different AOS categories, Value Theory has the highest permanent academic placement rate at 51%. That is, 51% of 2011-2021 graduates with a primary AOS in the category of Value Theory are now in permanent academic positions, excluding those now in non-academic positions. Following Value Theory is History and Traditions at 48%, Language, Epistemology, Metaphysics, and Mind at 43%, and Science, Logic, and Math at 43%.
What’s more, Value Theory has the highest placement into non-academic jobs: 16%. That is, a higher proportion of 2011-2021 philosophy PhD graduates with a primary AOS in Value Theory are now in non-academic jobs than any other category. This is followed by those in Science, Logic, and Math (15%), Language, Epistemology, Metaphysics, and Mind (13%), and History and Traditions (12%).
Given that the majority of graduates are not placed into permanent academic positions, we decided to look more closely at those in non-academic careers for this year’s survey. Marcus Arvan (Tampa) will be writing a blog post soon on this topic at The Philosophers’ Cocoon, and more details will be available in the final report when it is published. In addition, Eric Schwitzgebel (UC Riverside) will be writing a post on some of our findings at The Splintered Mind with respect to demographic representation in philosophy. These findings, including results from our first question on political orientation, will also be available in the final report.
In the meantime, you can take a look at an anonymized version of our data on the landing page of our website, some graphs and tables from past data pulls, blog posts at our website, including a 2020 post on the best PhD programs in philosophy, and links to past research reports, including the 2019 report on diversity and inclusivity.
In the next month APDA’s board of advisors will be meeting to discuss the transition to a board of directors model for the project. Your feedback on any of the above, including how APDA is run, is welcome and will be considered by both myself and the board.
* This sentence was edited; the original number of 127 programs was incorrect.
** This list was edited. Originally, Buffalo’s program had mistakenly been listed among the bottom ten; but it does not belong there. Relatedly, Temple University was added to this list.
I really appreciate the work the APDA is doing. But there are some very strange things going on in this post. For instance:
Why are we excluding those in non-academic jobs? I personally know a dozen people who are in non-academic jobs precisely because of their inability to find a permanent academic job. This seems to be an attempt to make the numbers look better? Why? Relatedly:
I fail to see what is worth celebrating about this. Only 15% find jobs in their first year on the market. That number is shockingly low.
In fact, all of the numbers here are terrible. This is an indictment of our system. The majority of graduates do not find permanent academic employment. If we don’t exclude the non-academic job holders, then it turns out (by the APDA’s numbers) that roughly 77% of graduates do not have permanent academic employment.
It is bizarre to me that the primary use of this data is being billed as “a guide to choosing graduate programs”. This data should strike everyone as deeply alarming for the health of our field. This should be a call to do something about the declining numbers of tenure track positions in philosophy.
So true. Shutting down a significant number of philosophy graduate programs is the only ethical thing we can do about it.
Disagree. Better if all programs cut their admissions in half—and, if necessary, in half again in a few years—until demand justifies doing otherwise.
And for those counseling undergraduates interested in pursuing the PhD: first piece of advice should be “don’t.” Second should be, “don’t accept unfunded or underfunded offers, no matter how many continuing students are funded.”
If anything unethical is going on, it’s taking students’ money in exchange for a vocational degree they will never use.
It seems better to me to have 50 universities that have a PhD program with 6 entering students every year, than to have 100 universities that have a PhD program with 3 entering students every year – it’s important for PhD students to have a cohort and a larger local community that they can discuss things in.
“Shutting down a significant number of philosophy graduate programs is the only ethical thing we can do about it.” I don’t think this would be a good idea, let alone the only ethical one, as I once explained here.
On the placement rate: while we did used to calculate it in the way you are suggesting, when we realized some graduates prefer non-academic careers (roughly the same proportion who are in those careers in our database) this method seemed to unnecessarily downgrade those careers. We had received this feedback multiple times (e.g. from Brian Weatherson, who was on the board of advisors last year) and made the switch. It is my hope that this and other changes to the project will help to elevate attention to non-academic careers, given our findings on salary and job satisfaction in past reports and the difficulties associated with finding permament academic work. As for the celebratory remark: this is precisely about whether there is a decline in the field. On this measure, there does not appear to be recent decline.
Carolyn, I appreciate the hard work you’ve put into this survey, but I’m confused by your reply to postdoc. You say, “when we realized some graduates prefer non-academic careers (roughly the same proportion who are in those careers in our database) this method seemed to unnecessarily downgrade those careers.” Could you clarify the part in the parentheses? What proportion of the 901 people in non-academic careers prefer non-academic careers?
Is there survey information on how many of the 901 people in non-academic careers prefer non-academic careers? What does it even mean to say “prefer” here, given the fact that fewer than 20% of graduates end up with a permanent job the year they finish their PhD? And what of background conditions? On paper, I had a permanent job, but the never-ending series of budget crises and re-organizations (not to mention the administration’s refusal to adopt even minimal COVID-19 mitigation policies) led me to weight my preference to stay alive and have some job security more highly than my preference to have an academic job.
Updated numbers will be provided in the final report, and possibly also Marcus Arvan’s post, but in the past around 92% have preferred an academic job and around 9% have ended up in non academic jobs. https://www.apaonline.org/members/group_content_view.asp?group=110435&id=918649
Hi Carolyn. Am I reading this right? In a pool where 77% of PhD’s don’t have permanent jobs, and where 92% prefer academic over nonacademic jobs, we are presented with a figure of 45% in permanent jobs by excluding those who currently have nonacademic jobs. That effectively doubles the percentage of people with permanent jobs (from 23% to 45%).
Did I flub a calculation here? Are those numbers wrong? Or did the pool of people under consideration shift? It seems like one shouldn’t exclude nonacademic job holders when calculating the percentage of people with permanent positions if 92% of the people who get PhDs prefer academic over nonacademic employment, and if the result moves the ratio from less than 1 in 4 to almost 1 in 2.
If I don’t exclude those now in non-academic careers then 39% of all 2011-2021 graduates in the database can be said to have permanent academic jobs (2606 of 6641).
Okay, thanks. If that’s right, then postdoc’s claim that 77% of graduates do not have permanent academic employment is wrong, and the difference goes from 45% to 39%. At a gut-level, that seems close enough not to elicit the worry that led to my first comment. Still, I wonder about the merits of a method that excludes from consideration a pool of people, 92% percent of whom prefer to have academic employment, when calculating the percentage of PhDs with permanent academic positions.
I must have typed in the numbers wrong the first time. So, a mere 71% of graduates do not have permanent academic jobs. This doesn’t strike me as a radical improvement.
But then, even assuming nearly all of the people who have non-academic jobs were the ones who preferred them (which strikes me as implausible), we still get that 55% of graduates who want permanent academic employment don’t have it. I don’t see why this by itself doesn’t strike everyone as extremely bad.
And all this leaves out the graduate students who want academic employment but leave before graduation because they recognize that they probably won’t obtain it.
This should serve as a call to action to those who already have power as tenured and tenure track faculty in the profession.
*61%
Yeah, I’m wishing for an edit button. I don’t think it materially changes the point, however.
Fair. I will look into the preference/placement issue again and see if I can add something to the report. Thanks for the feedback.
As someone who turned down a postdoc in “preference” for non-academic employment, I’d like to second postdoc et al.’s point. I’m casting “preference” in scare quotes because, while I did prefer non-ac employment to my academic future, what I *really* preferred was something that was no longer available to me: A decent-paying TT job that I had a strong chance of getting in the not-too-distant future. As much as I feel non-ac employment is every bit as valuable as academic employment, I want to be included in the number of PhDs who “didn’t make it”. I think it gives students a more accurate sense of what’s really going on.
Yeah, I know a lot of folks in Samuel’s position. I suspect I will be, too, after this year. So counting people in that category would be helpful.
Again, I really do genuinely appreciate the hard work being done by all the folks at APDA. I just want people to think about the placement rate of graduate students as a systemic problem that needs to be addressed, and not just something we direct potential students to take into consideration when deciding where to go to grad school.
Thanks for all the work you’ve done here; this is a really helpful dataset.
Just my two cents, as someone who will use data like these to advise prospective PhD students. The statistic I’d be most interested in seeing is percentage of admitted students with permanent academic employment. That’s not because I think that an academic career is more desirable than a non-academic career (if anything, I might think the reverse). Rather, it’s because I wouldn’t advise anyone interested in a non-academic career to get a PhD in Philosophy. If you want a non-academic career, you won’t need a Philosophy PhD and it’s better to get started down that career path now. So I think the pertinent question a prospective grad student should be asking themselves is: given that I attend this program, what’s the probability that I end up with permanent academic employment?
Ok, thanks. I will bring up this and the above feedback with the board of advisors to see if any changes are warranted going forward.
Agree, I think it’s important to include those who started but didn’t finish the PhD. It would also be interesting to see, perhaps, where they end up.
This is exactly correct. It’s true that there are many good jobs a person with a PhD in philosophy can do (and do well) outside of the academy. However, it’s nearly never the case that a PhD in Philosophy is the path I would advise for anyone who wants those jobs.
Do we have any idea how Philosophy compares with other disciplines, especially in the Humanities, in these regards? My conversations with colleagues in English, History, Religious Studies, and Classics departments leaves me with the impression that they are struggling even more than we are. But that’s just anecdotal.
I don’t have good comparisons with the humanities in general, but psychology (APA) reported a few years back that they place 44% of PhDs in tenure-track positions within 10 years of their PhD, out of all those in full-time academic work. (The denominator is obviously more friendly to psychology here, as ours includes those with no known employment and those in part-time positions.) https://www.apa.org/monitor/2017/06/datapoint
Similarly, history (AHA) reported that 43% of those in the 2011-2013 cohort are now in tenure-track positions, out of all positions. (Our placement rate is higher for PhDs from these years than for later years, as mentioned above.)
https://www.historians.org/wherehistorianswork
Hmm, that’s interesting. By these numbers, the difference between including and excluding PhDs in nonacademic positions (from the calculation of percentage of PhDs with permanent academic jobs) might make a difference. Because if we exclude them, we can say that philosophy seems to do slightly better than psychology and history (modulo your remarks about differences in datasets). But if we include that part of the cohort, then we have to note that philosophy actually does a bit worse than those disciplines. It would be great if we had info on the percentages of PhDs in psychology and history who prefer academic employment.
Relatedly, do you know whether the difference between those two calculations (one including PhDs in non-academic jobs, and one excluding them) has been trending in one direction or another in recent years? If it’s the case that the gap between the two percentages is increasing (now 45% and 39%, as long as everything currently upthread is correct), then that also suggests we shouldn’t be excluding the non-academically employed group from the calculation. And if not, not.
Also, I’d like to second Dmitri’s call for data on the ratio of admitted students to permanent positions. I would think that’s not hard to get in principle, though I’m sure it will call for more work from you and your team. But you’re doing the Lord’s work here, so thank you. And it’s the prospective students we should be focused on advising at this point, it seems to me. Those of us already in the pipeline have to wait it out.
Thanks, Preston. I don’t have a good general sense of how people calculate placement rate. There does seem to be a lot of variance. As for the number of admitted students, we have discussed doing this for years but find it to be very challenging to get good data on all programs. Programs don’t tend to provide this information publicly, and much of our data come from public sources (such as library dissertation pages). The APA has run a survey trying to estimate attrition, and discusses the challenges:
“Calculating an attrition rate is not straightforward. Many doctoral programs do not measure attrition, or at least do not publicly report that data. Moreover, the programs and universities that report attrition do not do so in a consistent way. Some track each entering cohort of graduate students and report the exact number of students that have left the program. Others only provide ten-year completion rates for their programs. Others format their data in yet another way.
We have reviewed public attrition data from 34 major doctoral programs in philosophy. Our preliminary analysis of this data indicates an average attrition rate from these programs of 27.2%.”
https://www.apaonline.org/members/group_content_view.asp?group=110435&id=918649#attrition
Thanks for this Carolyn. I’ve tried to keep abreast of this work, but I confess not to have given the admitted-students-to-permanent-employment ratio any thought until Dmitri mentioned it. And that’s a metric that potentially affects the rankings in significant ways. So that’s something prospective students should be sensitive to as well. But I can imagine it’s not so simple to get that data, and to get it in a way that is consistent across programs.
A final thought about the decision to exclude graduates who are in non-academic work when calculating percentage of permanently employed philosophers. Given that 92% of PhDs prefer to have academic jobs, I hope that decision is periodically revisited by looking at what it does to the numbers. If, for instance, the calculation that excludes those people consistently stays around the mid-40s over a number of years, while the calculation that includes them trends to a lower and lower figure, then I don’t think we’re doing prospective students any favors by excluding non-academically employed PhDs when we present percentage of PhDs with permanent employment. I have no idea whether that’s what you’ll see, but the fact that these people are being excluded from the calculation (when 9/10ths of them would rather have an academic job) is cause for periodically comparing the two calculations, it seems to me.
None of this is a criticism of you and your team’s work — I really appreciate all of the effort you’ve put into this, and your willingness to present it to the community and listen to feedback.
Good point. Will keep that in mind.
Im curious as to why 4/10 of the worst climate ratings are Canadian schools? I wonder what drives this trend
Maybe they thought it was about the weather.
*2/10
McGill, McMaster, Western, and York are all Canadian.
Funding, mainly.
Although two of them also had a sexual harassment issue among the graduate students in the recent past, so that may not have helped.
But I think it’s mostly the funding situation, whi b is bad after your fourth year (and hasn’t kept pace with Canadian cost of living, whhichnis skyrocketing).
I have written a post at BIOPOLITICAL PHILOSOPHY that responds to this report and in particular directly addresses the state of affairs in Canadian philosophy departments.
You can find my BIOPOLITICAL PHILOSOPHY post here: https://biopoliticalphilosophy.com/2021/10/06/a-response-to-the-apda-guide-to-graduate-programs-in-philosophy-based-on-job-placement-and-student-experience/
Thank your for this, as it seems like a lot of work that’s probably not compensated.
Perhaps I missed it, but how do you define “permanent” and did you separate out TT jobs from other kinds of permanent positions? It might also be interesting to see how many placements are in positions like community colleges as opposed to more traditional universities.