
Philosophy PhD Program Rankings: APDA’s 2017 Final Report
Academic Placement Data and Analysis (APDA) has released its complete 2017 Final Report, an 81-page document that collects data on PhD-granting philosophy programs (including ratings by former students, placement rates, and diversity) and the discipline as a whole (including hiring networks, placement maps, cluster analyses of programs, job descriptions, non-academic hiring).
The report was created by Carolyn Dicey Jennings, Patrice Cobb, Pablo Contreras Kallens, and Angelo Kyrilov, all of University of California, Merced.
Some of the data was reported on earlier.
APDA surveyed former PhD students, asking them, among other things: “How likely would you be to recommend the program from which you obtained your PhD to prospective philosophy students?”
The top 15 programs, on this metric, are:
- University of California, Berkeley
- Australian National University
- Georgetown University
- University of California, Riverside
- Harvard University
- Massachusetts Institute of Technology
- University of North Carolina, Chapel Hill
- Rutgers University
- University of Pittsburgh History and Philosophy of Science (HPS)
- University if Wisconsin-Madison
- University of California, Irvine Logic and Philosophy of Science (LPS)
- University of Colorado at Boulder
- Yale University
- University of Michigan
- Baylor University
You see the rest of the list beginning on p. 32 of the report, and in the infographic, below.
Placement rate in the APDA report “is calculated by taking all of the graduates in a specific time range and looking at their most recent reported placement type—permanent academic, temporary academic, nonacademic, or unknown.”
Below are the top 15 programs in terms of “permanent academic placement rate” for 2012-2016, that is, “the number of graduates in that time period who are now in a permanent academic position divided by the total number of graduates, of any placement type.” Listed for each department is both the “permanent” rate and the “PhD” rate, that is, the percentage of graduates to obtain employment in PhD-granting programs.
- University of California, Irvine(LPS). Permanent Rate: 82%; PhD Rate: 36%
- University of California, Riverside. Permanent Rate: 76%; PhD Rate: 18%
- University of Virginia. Permanent Rate: 76%; PhD Rate: 0%
- University of Cincinnati. Permanent Rate: 75%; PhD Rate: 13%
- Baylor University. Permanent Rate: 73%. PhD Rate: 5%
- University of California, Berkeley. Permanent Rate: 68%. PhD Rate: 59%
- University of Florida. Permanent Rate: 67%. PhD Rate: 0%
- University of Oregon. Permanent Rate: 65%. PhD Rate: 6%
- Indiana University Bloomington. Permanent Rate: 64%. PhD Rate: 9%
- University of Tennessee. Permanent Rate: 63%. PhD Rate: 0%
- University of Pittsburgh HPS. Permanent Rate: 62%. PhD Rate: 43%
- Georgetown University. Permanent Rate: 61%. PhD Rate: 4%
- University of Michigan. Permanent Rate: 60%. PhD Rate: 20%.
- Princeton University. Permanent Rate: 60%. PhD Rate: 36%
- University of North Carolina, Chapel Hill. Permanent Rate: 59%. PhD Rate: 26%.
Information on the rest of the programs can be found starting on p.44 of the report, and in the infographic, below.
An interesting aspect of the report is its look at hiring networks, data for which can be seen in tables, maps, and charts.
The report also includes a sorting of programs into different clusters by the keywords used to describe them, as depicted in the following dendogram:
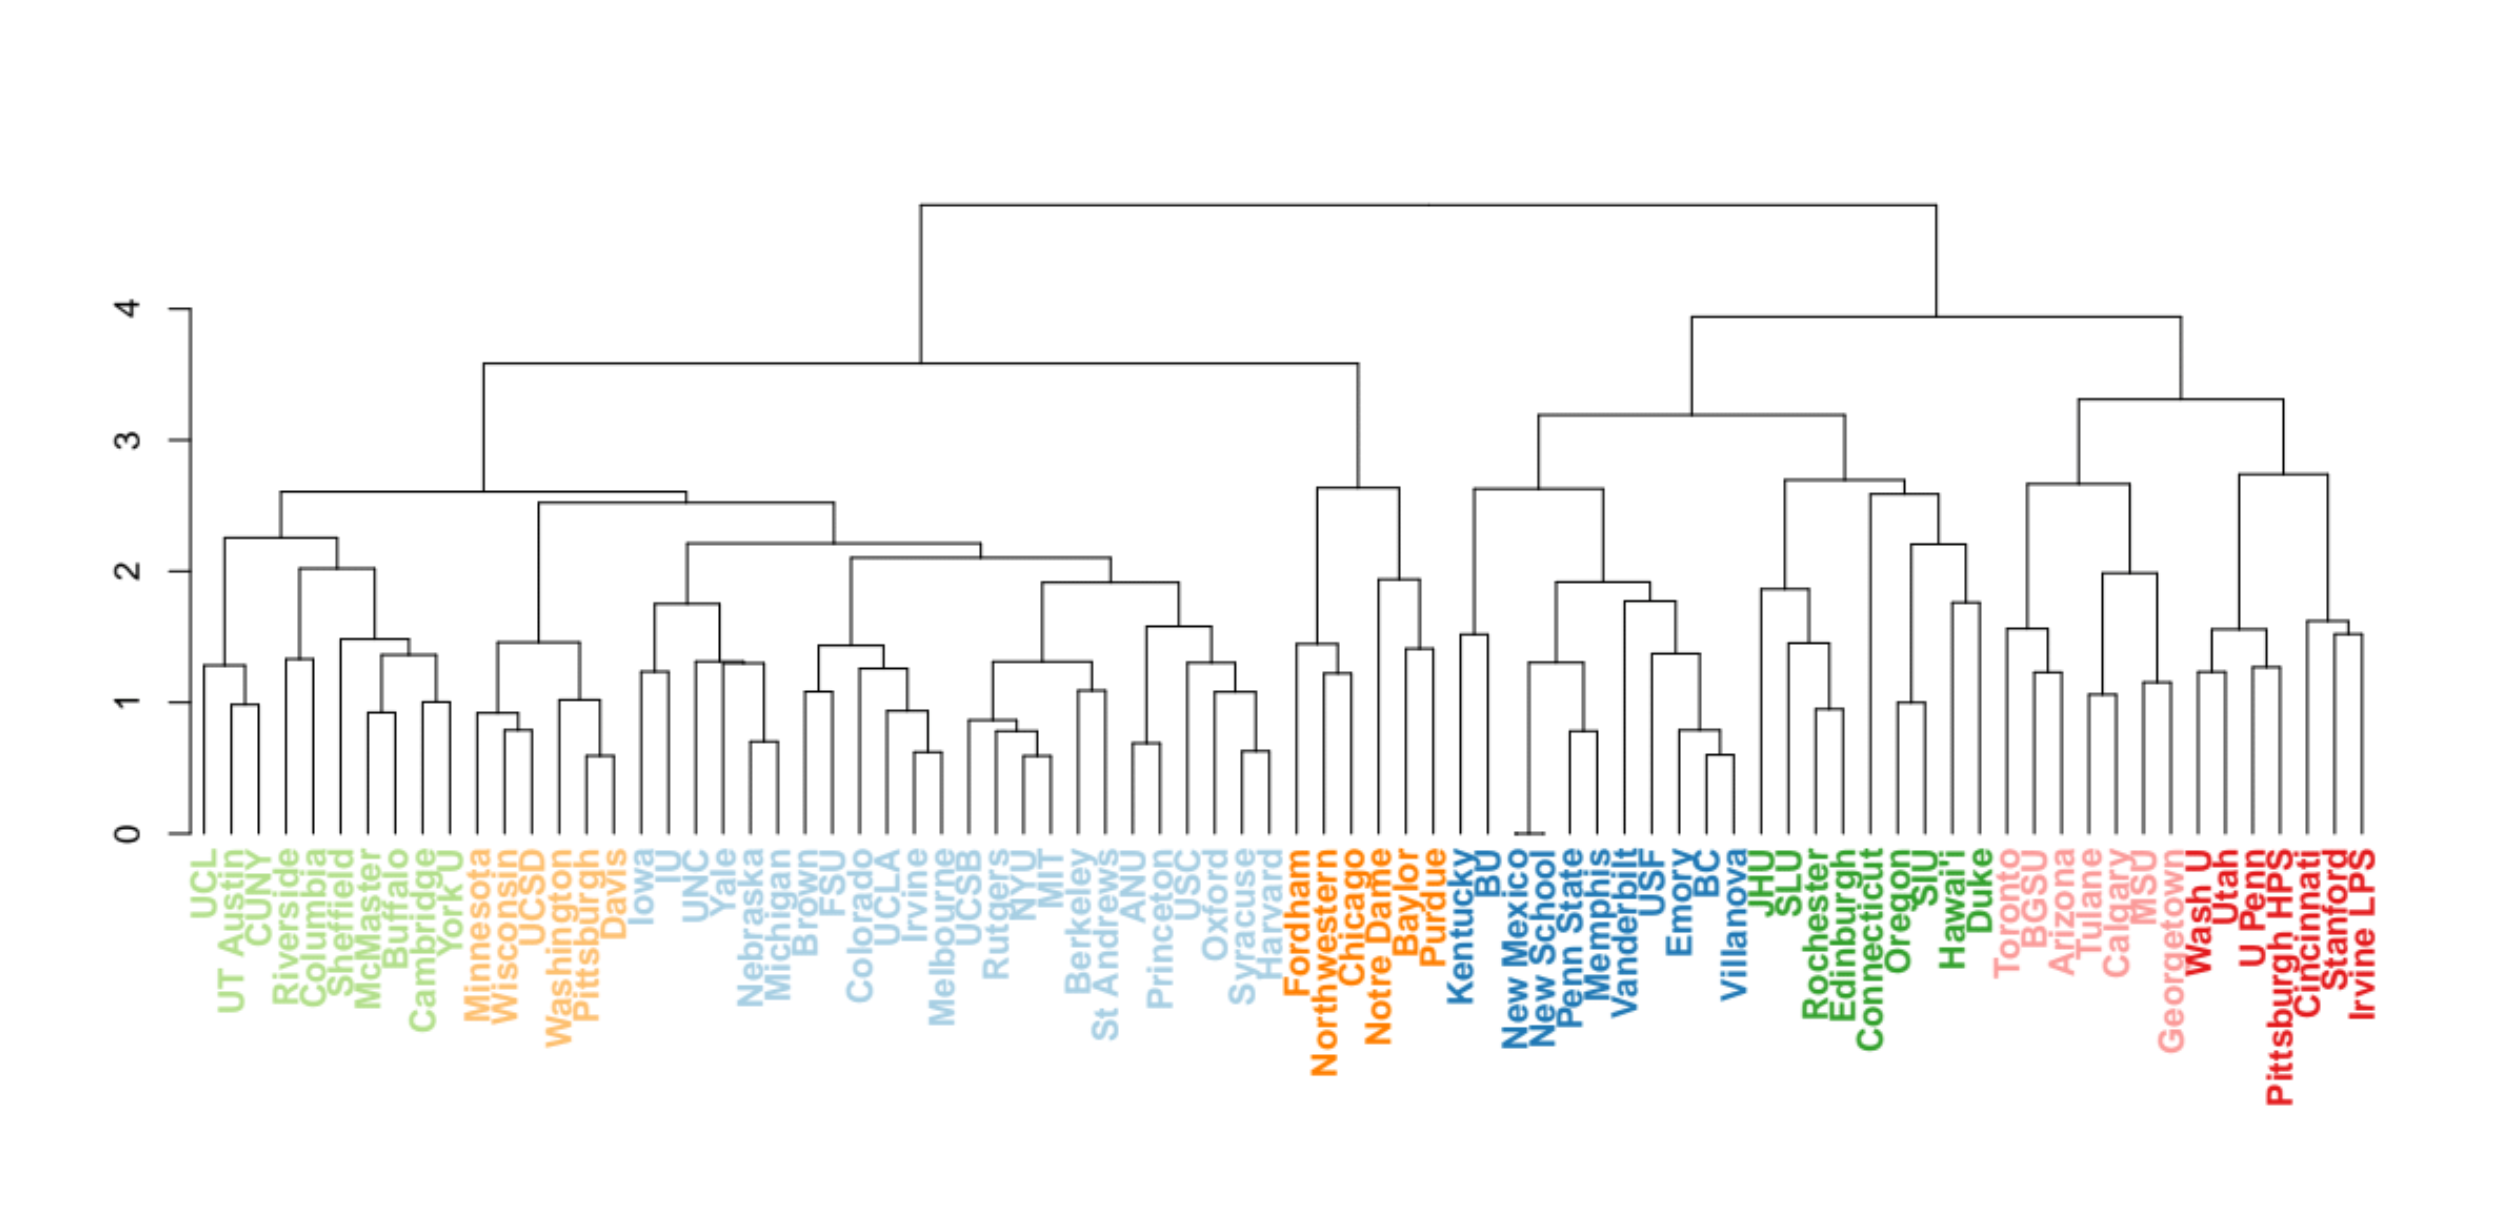
See p. 61 of the report for an explanation of how this was put together.
Regarding areas of specialization (AOS), the report finds (p.58):
In terms of AOS categories, the share of graduates in Value Theory of all known AOS categories has changed from 34% in 2006 to 31% in 2016 with a clear downward trend, but the share of graduates in LEMM has gone up in the same period, from 25% in 2006 to 30% in 2016.
The report has a wealth of other information. Discussion of any and all of it is welcome.
I’m no statistician, but some of these numbers don’t seem believable. Just for kicks I went to the UC Irvine placement site (http://www.humanities.uci.edu/philosophy/graduate/placement.php), and I calculate approximately 18% of their graduates from 2012 to 2016 (4 out of 22) with permanent placement, not the 82% listed in the report. What am I missing?
Ok. I now see that UCI is not UCI (LPS). I retract my question.
I suspect the APDA database is at least moderately biased in favor of better placement rates.
1. Programs with bad placement rates are less likely to advertise them. The programs included seem to be many of the big names.
2. I suspect those still in academia are more likely to respond to surveys about academic placement/be reachable at all. What is the response rate for the survey? How were participants selected? Randomly from the APDA database? I couldn’t find this information from looking through the report but maybe its buried there somewhere.
3. ‘Temporary placement’ can mean a lot of things. Does the candidate have a 2-3 year postdoc or serious teaching position or is he teaching a few courses for next to nothing in an adjunct capacity? Is this at his PhD granting institution? This kind of ‘placement’is really not what we’re interesting in. We want to know the % with real prospects, real jobs, decent incomes…
It’s hard to say how much the numbers should be corrected in any kind of scientific way. The best I can do is refer to anecdotal evidence. Based on my experiences and from what others have told me too I’d hazard that 50% of PhD graduates leave academia within 3 years.
Of course, this is just a guess! But I don’t buy that 36% of PhD graduates obtain a permanent job and 40% temporary work (unless by ‘temporary’we just mean teaching a class as an adjunct over the summer or something). I think a lot of people are leaving. In my PhD program quite a few graduates realizing the dire situation immediately went back to school after receiving their PhDs or looked for nonacademic employment.
Postdoc, much of this may be true, but the primary purpose of this study is not to measure the total employment percentage, it is to compare institutions. And as the years go by, and as institutions release more data, the extraordinary disparities are going to become even more apparent, as are the glaring mismatches between prestige and placement.
Hi Postdoc,
We did not rely on reported placements by program officers. We researched lists of all those who defended their dissertation (ProQuest, university library lists). We believe we have nearly complete records (of all graduates) for these 135 programs for these years.
I might have forgotten to include the way participants were chosen: all those in the database with an email address were included. We have email addresses for over half the database. Response rates were highest for those in permanent academic positions, I believe.
Carolyn,
Is it not true that those 135 programs were selected because they had placement pages and that the Proquest data was (mostly?) only used to check those 135 programs? That would seem to be what the report suggests.
The key sentence from the report is ”Most programs without a placement page were excluded.”
As programs with bad placements are unlikely to have placement pages, this means that your sample cannot be considered unbiased.
Yes I understand that an important aspect of the report is that it looks at the placement of those individual 135 programs, and surely that is valuable information.
However, I just want to caution people from making general conclusions about the profession based on the data in the report. People might start quoting average salaries, job prospects in general, and so on based on 135 of (probably) the best programs. This would be very deceptive to potential PhD students who do not investigate things more carefully.
Yes, you are right about that. But even leaving those programs out we are fairly complete. SED (Survey of Earned Doctorate) collects data on all graduate students in the United States. The number of students in the APDA database with a graduation date between 2011 and 2016 who attended a graduate university in the United States is around 90% of the number of graduate students recorded by the SED. Look at this graph for the years 2012-2016: http://faculty.ucmerced.edu/cjennings3/phildata/SED.png . Let’s say that we are missing 251 graduates from the United States between 2012 and 2016 (you can infer this from the numbers in the report in the section on Graduation Year: 37+62+53+47+52), that would need to be added to the 2264 known to be from the United States in this period (you can also see these numbers in the report). From the report you might estimate that 815 of these 2264 grads are in permanent positions (assuming the US permanent placement rate approximates the overall permanent placement rate for these years–36%). If you assumed that none of the missing 251 were in permanent positions, then the overall permanent placement rate would in reality be 32.4%. So, yet, it is possible that in reality the permanent placement rate is lower. But keep in mind that it is unlikely to be much lower. And also take a look at how careful we have been in our data collection and checking efforts when measuring this work against armchair intutions.
“The number of students in the APDA database with a graduation date between 2011 and 2016 who attended a graduate university in the United States is around 90% of the number of graduate students recorded by the SED.”
You mean between 2011 and 2014, if the report itself is accurate. So, we don’t know about 2015, 2016, and 2017.
Also, the SED is US only.
Are you claiming that the 135 programs (mostly?) account for 90% of English-speaking PhD’s awarded in the world?
I’m just guessing an average of two PhD programs per state, with some states obviously having a lot more than others. Then there are the other English speaking countries.
If there is government data on number of PhDs awarded in philosophy per year (and/or number of PhD granting institutions for philosophy) I’d appreciate a link to it. The report doesn’t seem to provide one.
I am claiming that we have reason to consider our data to be complete for 135 programs and nearly complete overall, which is how I believe we presented the information in the report. We know that we have around 90% of the graduates reported by the SED in our database, from which we have inferred that we have nearly all of the data for the US. Without some source for other countries, we cannot be sure how well we do there. But without some actual reason to think we do worse in other countries with English-language doctoral programs in philosophy, I see no reason to conclude that our data are less complete there.
SED data is publicly available. You could find it through links in the report (http://www.newappsblog.com/2016/01/women-and-minorities-in-philosophy-which-programs-do-best.html) but for your convenience, it is here: https://www.nsf.gov/statistics/2016/nsf16300/data-tables.cfm . You want table 13. 2015 data is now available, and we have 91% of the number of US graduates in our database that SED has for that year. We didn’t use data on the 2017 graduates in our report, because we know we don’t have complete data for that year yet (in part because it isn’t over).
Worth noting: SED organizes by discipline, not department. In the past we have noticed that SED must be including some non-philosophers in this group (based on data from the SED on individual programs). ProQuest, similarly, if searched by subject instead of department, will include non-philosophers. Many people in Critical Theory, for example, identify as philosophers. So we may in fact be doing better than 90% in the US.
In case you find data for other countries, here is what I have for our database:
2011 U.S. 418
2011 U.K. 91
2011 Canada 33
2011 Belgium 15
2011 Australia 9
2011 France 4
2011 Hungary 4
2011 Netherlands 3
2011 Italy 1
2011 TOTAL 578
2012 U.S. 489
2012 U.K. 120
2012 Canada 57
2012 Australia 23
2012 Belgium 15
2012 New Zealand 5
2012 France 3
2012 Netherlands 2
2012 Germany 1
2012 Italy 1
2012 Sweden 1
2012 Hungary 0
2012 TOTAL 718
2013 U.S. 457
2013 U.K. 142
2013 Canada 63
2013 Australia 21
2013 Belgium 13
2013 Hungary 8
2013 France 4
2013 Netherlands 2
2013 Germany 1
2013 New Zealand 1
2013 TOTAL 714
2014 U.S. 427
2014 U.K. 148
2014 Canada 64
2014 Australia 20
2014 Belgium 13
2014 France 4
2014 New Zealand 4
2014 Netherlands 3
2014 Hungary 3
2014 TOTAL 687
2015 U.S. 421
2015 U.K. 104
2015 Canada 65
2015 Belgium 26
2015 Australia 24
2015 New Zealand 4
2015 Hungary 3
2015 Netherlands 1
2015 TOTAL 648
2016 U.S. 470
2016 U.K. 83
2016 Canada 39
2016 Belgium 17
2016 Australia 9
2016 Hungary 3
2016 France 2
2016 Netherlands 1
2016 New Zealand 1
2016 TOTAL 625
2017 U.S. 226
2017 U.K. 40
2017 Canada 15
2017 Belgium 10
2017 New Zealand 4
2017 Australia 2
2017 TOTAL 297
Also, I can’t tell if you are aware of this or not from the way your response was framed (e.g. “Also, the SED is US only.):
the 90% number is ONLY for US graduates. We have many more in the APDA database than are in the SED database. But when I look at those in APDA from the US, it looks like a total number that is 90% of the numbers SED provides.
Thanks Carolyn,
You have helped assuage some of my concerns.
Could you explain Appendix B to me? It seems there are a lot of programs not included.
University of Reading
University of Warwick
University of Nottingham (not listed in the report whatsoever)
University of Sussex
University of East Anglia
I’m just listing a few. I know for a fact that at least some of these programs have pumped out a notable number of PhDs. So, you’ll forgive me if I’m skeptical that your data is complete for the UK.
Postdoc,
Thanks for pointing out Nottingham. I will add them to our list.
As for the four others: we have 50 graduates for the years in question. Not being included does not mean not having data–it just means we are not sure whether our records are complete, and so we did not include those programs in program assessment. Between 2012 and 2016 we have 13 records for Reading, 7 for Warwick, 14 for Sussex, 16 for East Anglia. These would all be included in the claim that 36% of 2012-2016 graduates in the database are now in permanent academic positions.
Carolyn,
Thanks for clearing that up. It’s a very long report and I could not tell what was going on in places. It seemed to me you were saying those programs were not included in the data.
Is there a breakdown of the temporary placement category for the 2012-2016 years?
Yes–and yet it is still incomplete. The nature of the beast. You want the section called “Placement Types” under “State of the Database”: “These numbers change somewhat if we restrict this to graduates between 2012 and 2016, the years for which we have the most complete data (and so for which our data is less likely to be biased). In that case, 36% are in permanent academic positions, 40% are in temporary academic positions, 9% are in nonacademic positions, and 15% have unknown placement status.” Those 40% include postdocs, visiting, lecturers, instructors, adjuncts, and other.
Thanks for linking to this interesting data. One thing it might be good to clarify in the post is that this report only covers American programs.
Hi Jonathan,
It actually aims to cover all English-language PhD programs in philosophy.
Oh, I apologize! I read the thing about Carnegie classifications for American universities and over-interpreted it
What are we supposed to learn from having placement records ranked in this way? Given the differing abilities of entering students it’s impossible to draw conclusions about either the quality of the graduate education OR how well the department does at finding jobs for its students.
Are you saying that the placement rate data is itself not informative, or just that its presentation in a ranked ordering is not informative?
I think the presentation in a ranked ordering is useless or worse.
The statistics themselves are fine if accurate, though it’s hard to learn much from them.
The data seem informative to me. Several Leiterific programs fall outside of the top 50 or even 60 in placement. That’s probably not due to a lack of “abilities” of entering students. If I were a prospective student, I would want to know that that prestigious program isn’t placing 2/3 of its students, and those it does place make on average barely enough to raise a family in Nebraska.
I may be missing something here, but why are programs with the same placement rate not given the same rank? What makes Michigan a rank higher than Princeton, rather than even, or Riverside higher than UVA?
Organized by permanent academic placement rate then permanent academic placement rate into phd programs. I will look into Michigan and Princeton, but probably there is a very small percentage difference that appears absent due to rounding for presentation purposes.
Michigan is exactly 60%, Princeton is 59.5744680851064%. I probably should have sorted by the rounded numbers to prevent confusion, but I didn’t–I sorted by the actual values.
Aww, yay, very pleased to see UW-Madison (my BA and MA alma mater, even though I didn’t complete my PhD there b/c logic was not “philosophical enough” in the early 00s) high up the list. It is in all respects other than the one that caused me to leave, an excellent city and a great school with great people.
Hey! UBC has 0% faculty of colour and I’m one of them!
What a Herculean effort! Thanks to Carolyn Dicey Jennings and her collaborators for underatking this project.
I was surprised to see that some programs have actually been placing 75%+ of their graduates in TT jobs. I checked a few placement webpages to see if they were consistent with those figures, and the pages for Irvine (LPS), Riverside, and UVA are were (roughly, anyway). Wow! Very impressive.
The data presented on Cincinnati’s placement webpage were not consistent with figure given in the report. According to Cincinnati’s placement page, at most 50% of its graduates from the relevant period are currently in TT jobs. That’s a really good placement rate in the current market, but it wouldn’t make the top 15 in this list.
I wonder if this is a problem with the APDA data, or with the Cincinnati web page? Cincinnati appears to have graduated a small number of students in the last few years, so small variations in the data could make a big difference.
Thanks, S!!
On Cincinnati, we are dealing with small numbers as you note. Although I was not the person who checked these pages (in Appendix B you can see when we checked the pages and who did the checking), due to the small numbers I can check this fairly easily. Also, note that anyone can check the placements we have and how they are coded by looking here: http://placementdata.com/ . Below are the listings from Cincinnati’s placement page with names removed, and my notes. It looks to me as though 6 of the 8 are permanent, which is 75%:
2016:
8) Visiting Assistant Professor, Centre College
2015:
6) Assistant Professor of Philosophy and Cognitive Sciences (TT), University of Central Florida, Orlando, FL.
7) National Science Foundation Postdoctoral Fellow (SPRF-IBSS program), Department of Psychology, University of Cincinnati (2 yrs).
2014:
5) Assistant Lecturer (Continuing), University of Toledo.
<>
2013:
4) Assistant Professor (TT), Center for Learning Innovation, University of Minnesota at Rochester, Rochester, MN.
2012:
1) Lecturer, Hang Seng Management College, Hong Kong
<>
2) Assistant Professor of Philosophy (TT), Flagler College, St. Augustine, FL. Previously: Visiting Assistant Professor at University of Arkansas, Little Rock.
3) Assistant Professor (TT), Istanbul Technical University. Previously: Postdoc, CCCOM, University of Tartu, Estonia; Visiting Assistant Professor at Southern Methodist University, Dallas, TX; faculty, University of New York in Prague.
https://ssc.hsmc.edu.hk/academic-staff/wong-muk-yan/
oops, adding “<" removed my notes, since the commenting system interpreted them as html commands. Trying again:
2016:
8) Visiting Assistant Professor, Centre College
2015:
6) Assistant Professor of Philosophy and Cognitive Sciences (TT), University of Central Florida, Orlando, FL.
7) National Science Foundation Postdoctoral Fellow (SPRF-IBSS program), Department of Psychology, University of Cincinnati (2 yrs).
2014:
5) Assistant Lecturer (Continuing), University of Toledo.
*This is marked in our database as a permanent lectureship, which looks right, given her website (https://ninaatanasova.wordpress.com/).
2013:
4) Assistant Professor (TT), Center for Learning Innovation, University of Minnesota at Rochester, Rochester, MN.
2012:
1) Lecturer, Hang Seng Management College, Hong Kong
*This is marked in our website as TT, which looks right given his website: https://ssc.hsmc.edu.hk/academic-staff/wong-muk-yan/
2) Assistant Professor of Philosophy (TT), Flagler College, St. Augustine, FL. Previously: Visiting Assistant Professor at University of Arkansas, Little Rock.
3) Assistant Professor (TT), Istanbul Technical University. Previously: Postdoc, CCCOM, University of Tartu, Estonia; Visiting Assistant Professor at Southern Methodist University, Dallas, TX; faculty, University of New York in Prague.
Thanks so much for taking the time to clarify this! Much appreciated. In retrospect, I shouldn’t have assumed that I could always tell whether a job was permanent based on the job’s title. The link to the raw data is also super helpful — thanks for that, too.
The degree to which the University of Toronto friggin’ ROCKXXXXX(orz)!!! is not adequately reflected in the data. Please compensate us.
So this is funny, but there is also a serious criticism that could be lurking behind it. In that case, note that we do include subjective reports, but only from past graduates, and only when those past graduates have elected to make them public. (Note: one should not assume that those not made public are primarily negative–I have not found that to be the case. We will try to code the non-public ones for keywords and affect in the future.) The comments for Toronto are as follows (in order of date provided, also given in the report):
“It depends enormously on which area you work in: except for ancient/medieval or political philosophy, you have to be lucky to get a decent perm. job soon enough not to despair…”
“The U of T Department of Philosophy is known for its large faculty. This is a major resource. For those who come into graduate school with a less-defined sense of what we want to work on, the size of the U of T faculty offers ample opportunity to learn about different areas from world-leading experts. This means that you might start out in Ethics, get tempted by Ancient or Early Modern, and then end up doing something in Mind or Language or Metaphysics.
I also found the departmental culture very conducive to getting good work done. The graduate student community is supportive, but not suffocating. Students are largely left to figure out their own path, both philosophically and socially, yet with the clear expectation that help will be there for them if they ask for it.
The department also provided ample opportunity to acquire teaching experience, both as a TA and as an instructor. Yet the teaching demands were relatively light, and it is possible to go many semesters without teaching if you so desire.
Toronto is also a fabulous city in which to live. Large, but not overwhelming, it provides a life outside of school. “
Carolyn — My comment was intended as nothing more than a parody of the frothing-at-the-mouth internet style, but thanks anyway for your response. I would say, in response to the first comment you posted, that in the last five years, we’ve placed people outside of ancient and political in permanent/TT jobs at (off the top of my head): McGill, LSE, Fordham, UVA, UC-Riverside, Bryn Mawr, Iowa State, and several other desirable departments.
Wow. This must have required an enormous amount of work and coordination with departments!
Question 1: Does the database distinguish between students that defended and then never applied for jobs in philosophy (of any kind) and students that defended and did apply for jobs on philosophy?
After all, many students defend even though they don’t plan to go into academic philosophy – because, say, they decided in year 3 or 4 that academic philosophy didn’t meet their expectations (for whatever reason). And many programs do well to help these students find employment outside of academic philosophy. But these helpful programs could look gratuitously bad in these rankings if the database doesn’t account for whether their graduates applied to jobs in academic philosophy.
And if that is right, then these rankings might incentivize PhD programs to admit those students that seem most likely to get an academic job after graduating. And I wonder if that incentive could have pernicious effects (e.g., admitting students that are more likely to get jobs, but for reasons that wouldn’t/shouldn’t otherwise feature in admissions decisions).
Question 2: Is the database publicly accessible? Why or why not?
Hi Nick,
Yes, it did. My collaborators and I worked very hard, but especially in the last month.
On 1: No. We assume that for the most part programs will have around the same number of graduates who choose a nonacademic career. Unfortunately, it isn’t possible to find out which students wanted an academic or nonacademic job without simply asking them. We did ask graduates about their preferences in the 2017 survey, and the majority said that they preferred an academic job: 97% of those in temporary positions, 98% of those in permanent positions, and 62% of those in nonacademic positions (see “Placement Preferences and Nonacademic Preparation”). Moreover, those in permanent academic jobs were rated as having the best placement fit, in responses from the 2016 survey (see the same section). We believe that as most students go into graduate school wanting a permanent academic position, and most report wanting a permanent academic position once graduating, that it makes sense to concentrate on that type of job in sorting graduates in this list. To do something more complex I think we would have to know every graduate’s placement preference. For now, perhaps the graduate student ratings may give a sense of student satisfaction that is separable from the permanent academic placement rate. If you have ideas on this, let me know.
On 2: Yes. All of our listings are here: http://placementdata.com/ . In terms of individual datasets used for each analysis–no. We will provide those when we publish this work in a journal.
I see. Thanks very much for this clarification. It’s helpful to know that more than half (albeit only 60-ish percent) of people in non-academic positions preferred (that took the survey) preferred academic employment.
And thanks for striving to publicize the data!
And thanks again for you and your collaborators hard work on this!
“[T]he percentage of women faculty and faculty of color were determined as best judged by [an] Undergraduate Research Assistant” (p. 48).
One wonders whether it is responsible to publish a list purporting to be a profile of academic departments on this basis. My department is listed as having <5% faculty of color rather than close to 20% as we actually have, i.e., top-10 in the list rather than fifty places lower, assuming the other figures are remotely accurate.
Hi Plotinus,
Can you send me an email please? [email protected] or [email protected]
Thanks to Carolyn and the APDA for amazing work!
Unfortunately the numbers for Rutgers are slightly off, due to an error on our part (2 students with permanent positions were not entered correctly). Rutgers was listed at 59%, 38%. The correct numbers are 65%, 41% (which moves Rutgers from 16th to 8th).
Carolyn has updated the infogram, but it is too late now to change the report itself. Still, students interested in using these numbers should know the correct numbers.
Carolyn Jennings,
I appreciate your using third party data to check your numbers, as I suspect many will be suspicious of the APDA’s accuracy and completeness. The fact that the APDA totals for the US are 90% (about) of the SED totals, as you mentioned in response to another comment above, is a good sign.
However, as we do not have SED numbers by department, only by the user selected ‘primary field of dissertation research’ (presumably the relevant question on the survey), we have to be weary of the totals. There is no reason to think that people select ‘philosophy’ just in case they graduated with a PhD from a philosophy department, or even, more generally, with a PhD in philosophy.
As you pointed out, many who choose ‘philosophy’ may not be graduating from philosophy departments but, for example, from English departments. This works in your favor.
However, it’s also almost certain that many who are graduating from philosophy departments are not choosing ‘philosophy’ as their ‘primary field of dissertation research.’
Looking at the list of options for that question you find (on page 6 here https://www.nsf.gov/statistics/srvydoctorates/surveys/srvydoctorates_2015.pdf)
1. Under mathematics there is the choice, ‘logic.’ This is a core area of analytic philosophy.
2. Under humanities there is the choice, ‘ethics.’ This is a core area of analytic philosophy.
Both of these at minimum likely include people from philosophy departments or with PhDs in philosophy.
Once you go down this road it’s not hard to see that many other fields listed could be selected by a PhD from a philosophy department.
3. Under mathematics, ‘topology/foundations.’
The foundations of mathematics is a traditional philosophical subject. Anyone working in this area is likely to choose this option, not ‘philosophy.’
Moving on we find,
4. Under humanities, ‘Religion/religious studies.’
5. Under fields not elsewhere classified, ‘theology/religious education’
Arguably many PhDs in philosophy of religion likely would choose Religion or Theology as their ‘primary field of dissertation research,’ not ‘philosophy.’
6. Under education, ‘social/philosophical foundations of education.’
I remember studying the philosophy of education in a course taught in a philosophy department.
I could go on and on I think. For example, would someone working on the philosophy of disease end up choosing something in the biology category? Arguably someone working on the philosophy of epidemiology would choose ‘epidemiology’ as their ‘primary field of dissertation research.’
In conclusion, there are strong reasons not to believe that the numbers for ‘philosophy’ accurately represent the numbers of PhD’s in philosophy or the numbers graduating from philosophy departments. The issue is that the SED does not ask from which department you earned your PhD, and people in philosophy departments study all sort of things. You can do a PhD associated with music, or physics, or history, or…
At minimum, I would think you need to add to the ‘philosophy’ SED data the numbers from ‘ethics,’ ‘logic,’ and ‘topology/foundations.’ These are core, traditional areas of analytic philosophy.
From further investigation into the numbers it seems the report in figure 2 is collapsing the SED categories ‘Philosophy’ and ‘Ethics’ together, although the report does not say this as far as I can tell.
What is the justification for combining these categories but not including ‘Logic’ and ‘Topology/Foundations?’
I guess the obvious answer is that it’s under ‘Humanities,’ whereas those other categories are under ‘Mathematics.’
However, as logic and the foundations of mathematics, and arguably topology, are traditional areas of analytic philosophy, they should be included regardless of whether the SED considers them part of the humanities.
Whatever the historical status of topology, these days it is a technical area of pure mathematics.
Hi Pendaran,
You are right that we included both Philosophy and Ethics in generating the 90% number. SED only separated these in the past three years, I believe–someone at SED recommended using both categories when Eric Schwitzgebel asked for the data on philosophy. We do have the SED numbers by department, but I haven’t gone through to check each one. I don’t think philosophers would choose a mathematics subfield as their main field, simply because it is listed under mathematics as the primary field. I think there really is an asymmetry to this issue–philosophers identify as philosophers, but other groups also identify as philosophers, despite not being in a traditional philosophy department (and, of course, we include some other departments in our database of this kind, just not all of them). Yet, it might be worth exploring this more in the future, so thank you for taking the time to think through and point out some of the issues.
I do not share your intuitions about how people would answer the question of interest on the survey. The question asks about the primary field of your dissertation research. That’s the question that the data is based on in table 13, I’m pretty sure. If so, I would suspect someone working on logic to choose ‘logic’ and someone working on foundations to choose ‘topology/foundations’ and so on perhaps.
However, we don’t need to debate it. If you have data categorized by PhD awarding department, then why not just use that data? That’s really what we’re after anyway. Right?
We have data by university, not department–sorry, I wasn’t clear about that.
In that case I think we should be careful using the numbers for ‘philosophy’ to indicate numbers of graduating PhDs in philosophy. We have the issue of English PhDs choosing philosophy, because they associate with the discipline more than with English. However, likewise, I suspect some philosophers associate more with ‘logic’ than with ‘philosophy’ or with ‘topology/foundations’ more than with ‘philosophy.’ Also, arguably, some percentage of PhDs in philosophy is scattered around in other fields, for example, it seems quite plausible to me that some portion of those studying religion would choose the ‘religion’ category. It’s sloppy to use data for ‘major field of dissertation research’ to indicate ‘PhD granting department,’ especially today where interdisciplinarity is emphasized so much.
Although I am being critical in these posts, don’t confuse that with my being unappreciative for your hard work. I appreciate that you put this report together and the great deal of work that must have been. Thank you.
the report is fascinating. thanks for all the hard work! i see that in the current placement success tables, postdocs are treated the same as VAPs, adjunct positions, and failures to achieve any position. but in fact they’re quite different — postdocs are much more attractive. and students who get postdocs are much more likely to get a t-t job eventually. our experience at NYU is that quite a few students go straight into postdocs without even applying for tenure-track jobs. looking at the NYU placement page, 26 out of 29 ph.d’s since 2012 are currently in either t-t positions or postdocs: 15 t-t, 11 postdocs. most of the postdocs are multiple-year research postdocs, which are basically dream jobs. it would be interesting to see an analysis in which postdocs were treated as successes rather than failures.
Thanks, Dave!
While it helps to make your point, I don’t prefer the language of “success” and “failure” in this context. I think we have to be careful not to think of and talk about graduates that way, especially in such a tough market, and so we try not to use that kind of language in our reports. We are simply trying to best capture differences that prospective graduate students (and others) care about. These decisions are hard, but here are some reasons to support the current division:
–graduates for the most part prefer a permanent academic position over a postdoctoral position, especially in the long run (see our section on placement fit);
–treating postdocs as different from VAPs would prioritize research positions, since it is more standard for those on a teaching-focused track to go to VAPs and then to teaching-focused jobs (and some positions are called postdocs despite being essentially VAPs);
–when we look at a fairly long time range with a buffer (in this case, 5 years with a one year buffer–we left out 2017), we are looking at graduates who have had a chance to get both a postdoctoral and a permanent position–on average, 4 years (assuming that graduates go on the market for the first time in the year of graduation, 2012 graduates have had 2012, 2013, 2014, 2015, 2016, and 2017 to achieve a permanent position–6 years; 2016 graduates have had 2016 and 2017–2 years); and (least importantly, perhaps)
–I am not as confident in the accuracy of our postdoc data, since we focused in our checks on being sure that the difference between permanent and temporary was accurate, but not on finer-grained differences within those categories.
What I would like to do in the future is to calculate the odds of achieving a permanent job given different types of temporary jobs. Then we would know the extent to which those in postdocs are more likely than VAPs, say, to get a permanent job in the next year. At the moment, I don’t have those numbers. But it would be interesting to know. One thing I have noticed with this project is how surprised people are by the data–so surprised that they sometimes reject the project out of hand, treating APDA like InfoWars (ok, we may not be the NYTimes, but I am no Alex Jones). So it may not be true that postdocs are more likely to get permanent jobs, even if that seems reasonable. I would want to find out based on the data we have.
Some thoughts:
1) I take Dave’s point to be not that a postdoc is preferable to a TT position, but that a postdoc followed by a TT position is preferable to a TT position straight after graduating.
2) I don’t think the “4 years on average” point is persuasive. To take an extreme illustration, suppose that every postdoc gets a TT position 4 years after graduating. If you’re sampling a group who are between 2 and 6 years from graduating, 50% of them will show up as attaining a TT position, whereas the right longterm answer would be 100%.
3) I don’t think calculating the likelihood of getting a TT job given a postdoc entirely addresses the issue. There’s no reason to think that a postdoc with a PhD from university A and one with a PhD from university B have equal chances of obtaining a TT job.
4) I would have thought the way to address the delayed-route-to-TT issue is to look at what fraction of people have a TT job (say) four years after graduating. (Of course that means only the data from people who graduated in 2013 or before is usable.) Is that something that can be pulled off your dataset straightforwardly?
On 1) I think that the comparison would need to be someone getting a postdoc with no promise of a TT job versus getting a TT job, since those who get a postdoc and a TT job right out, but defer the TT job, are marked as TT for this analysis. I do not think that, on average, graduates and prospective graduate student prefer a postdoc with no promise of a TT job.
On 2) Right, I take it that is how averages work. I think the average should reflect graduates’ ideal number of years out, rather than the minimum reflecting graduates’ ideal number of years out. I once wrote a post on this where Dave and I had a very similar exchange: http://www.newappsblog.com/2014/07/why-recency-and-time-frame-matters.html . Right now, all graduates included have had a minimum of two years to find a job, but an average of 4 years. That seems reasonable to me, in terms of representing graduate student interests.
On 4) Yes. We used to do this. One reason we didn’t in this case is that our placement year data have gaps–we cannot be certain in many cases whether or not someone was placed within 2 years because we don’t know the year of placement. Also we want the data to be as relevant as possible, which means as recent as is reasonable (see the blog post linked above).
The UK point is a good one. It would affect Australia and New Zealand, too. The question here is whether prospective students would want to know in comparing, say, Oxford and Princeton, whether one places graduates faster. Let’s say that Princeton students are getting permanent positions 3 years faster, on average. Perhaps useful to know would be what is the total number of years from signing up for that graduate program to the first permanent position–then, if Oxford students are graduating faster but taking postdoctoral positions that might put them on the same timetable as Princeton. My guess is that philosophy graduate students in the US take on average 7-8 years, as with the rest of the Humanities. I would guess that philosophy graduate students in the UK take on average 4-5 (I am including the Master’s degree in my guess for the UK, since that is normally separate). In that case, graduates in the UK would be on an equal footing to those from the US if they took 3 years longer to achieve a permanent position. But is this equal in the eyes of prospective graduate students? I can imagine that having the protection of still being in the graduate program for those years might be preferable to being in temporary positions all that time. More thoughts on this issue are welcome.
Actually, one more thought:
5) This is particularly an issue for the UK. There is no such thing as a tenure-*track* position in the UK; permanent teaching positions are most analogous to Associate Professorships. Combine that with the fact that UK PhDs are shorter and it is really rare for a UK PhD student to go straight to a permanent job. The traditional “golden path” for a UK humanities academic is PhD -> junior fellowship at Oxbridge/British Academy junior fellowship/Leverhulme junior fellowship. Those normally last 3 years. (Longer for women, anecdotally, as it’s a reasonably good career point to take maternity leave.)
Just to illustrate my suggestion (4), I quickly did the analysis for NYU.
Current status of NYU students graduating 2012-2016 (from APDA report supplemented with Chalmers’ post above)
TT in PhD-granting universities: 31%
TT in other universities: 19%
Postdoc: 38%
Other: 12%
Current status of NYU students graduating 2011-2013 (from NYU placement page cross-checked against APDA list)
TT in PhD-granting universities: 62%
TT in other universities: 6%
Postdoc: 13%
Other: 19%
Of course that’s only one university, and of course 2011-2013 is a smallish dataset, but still, it illustrates that things can look quite different if you give people time to work through their postdocs into their eventual destination.
Right–all universities do better in terms of placement rates when given more time. The question is about relative placement rates here. Should this list capture the difference between a program that has a 62% placement rate only after 5 years and one that has a 62% placement rate after 2 years? Do graduates/prospective graduate students care about this difference? I think the answer to these questions is clearly yes. If you see the post I linked to above, you will see that at a certain point placement rates stabilize, but many students care not just if they will ever get a permanent position but also how long will it take and how hard will it be to get there. In my view, graduates prefer a shorter time window with less uncertainty, as in perhaps every other profession.
I don’t think there’s any univocal answer as to what “graduates” want. Different graduates will want different things according to their assessments of their prospects. A research-oriented graduate student fairly confident of their prospects of landing a tenure-track position in due course, and expecting to land a better position once their research is stronger, will prefer a good postdoc to a 4:4 tenure-track position.
(In any case, if you think 2 years is the right timeline to work on, that’s an argument for looking at placement within 2 years, not placement within an average of 2 years, which I still don’t know how to conceptualise.)
But look: one of the values of collecting a robust dataset is that different people can do different queries on it and return different information. Is your dataset available in a reasonably manipulable form? (I can get it from the website but only in a form that needs hand-entry.) I’d love to play with it.
I think you are right, David, that placement within 2 years is better. I don’t think it makes sense to do that for practical reasons at the moment, but when we can be more confident in our placement year data this might make sense.
The datasets are not currently available (beyond what you see on the Infogram–you can download those), but we will make them available when we prepare for publication. Our database is made up of 30+ tables in SQL. For each type of research question we have to write a separate QUERY. (The one you are referring to looks at most recent placement, for example, but our first report used a QUERY that gave us whatever the first permanent job was.) Then the output is in codes only we understand. Plus the information includes private data that have to be removed. We will do all of that in the next year or so, alongside the written version for publication, when we have time for these projects. We prioritized getting these findings to the discipline as soon as possible, meaning that I personally worked 70+ hour weeks for the last month or so on this project just checking the data (due to feedback from Eduouard Machery and Ned Block, making me think this was important to the discipline), and then in the last week running analyses and writing this report. So I just haven’t had time to do anything else–my own research included–much less write it up for publication and provide publicly accessible datasets for every analysis. We will do that, but we need some time. When that time comes, please feel free to play around with the data.
Putting aside entirely questions of logistics and time (the luxury of the armchair commentator) I think the most sensible thing is just to let the user choose a timescale. I think 4-5 years is sensible; you think 2; but I’m not choosing a graduate program and neither are you; presumably people can make their own assessments.
As for the raw data, I entirely understand that one’s own dataset can need a lot of cleaning up (and I equally-entirely understand the way in which this sort of project can expand and eat into time that really ought to be reserved for other activity). My query was “is this available”, not “I demand that you provide this”! I’m happy to wait. (I’d have been happy just to get the SQL tables – I know SQL and can do my own queries – but I appreciate there are data protection issues.)
One really nice feature of the APDA report is its “placement network” function (at 4.3.3, see especially the URL in that section). I’m not sure I fully understand the underlying theory, but basically it links universities together according to which universities have placed students at which other universities. By expanding the number of permitted nodes you get successively larger networks (I think what’s going on is that the code returns that network with the permitted number of nodes which has the largest number of placements in it). For instance, the first 10 universities (worldwide) are Berkeley, Cambridge, NYU, Oxford, Pittsburgh, Princeton, Rutgers, Stanford, Toronto, UNC-Chapel Hill.
I couldn’t help noticing that those are also universities that score highly (in most cases, *very* highly) on the PGR. So
I’ve been entertaining myself by exploring more systematically the connection between these placement networks and the 2008 PGR rankings (2008 because these are students who applied for posts between 2012-2016 and so presumably applied for grad school between 2006-10). The placement network is a startlingly good predictor of PGR score.
To expand: define a university’s Network Rank as the size of the smallest network containing it (and then discard all the non-US universities and rescale – I was only looking at the US). I find that:
– All but one top-30 (US) PGR university has a Network Rank of 50 or less (the exception, only just, is UC Irvine: PGR rank 20, Network Rank 51).
– Conversely, all but two universities in the Network top 30 have PGR ranks of 50 or below (the exceptions are Fordham, network rank 23, and SUNY Buffalo, network rank 27).
– Of the 40 universities that are both in the top 50 network ranks and the top 50 PGR ranks, the correlation between network rank and PGR rank is an impressive 0.700.
That doesn’t lend itself to a unique interpretation (it seems compatible with both the sunniest interpretation of PGR, that it accurately tracks some objective standard of quality, and the darkest, that it reveals the profession’s nepotism!) But it’s pretty strong evidence that the PGR tracks *something*! At the very least, if you want a TT job at a high-PGR-ranked university, go to grad school at a high-PGR-ranked university.
This is interesting–thanks, David. Note that I did include postdocs in this case. (So if it says 5 from Uni A were placed at Uni B, that could be 3 TT and 2 PD.)
I tried to look into the basics of the network algorithm but I can’t find them; it might be proprietary. (If anyone knows, I’d be interested.) So I did my own analysis with the raw dataset used to generate the networks. (I’ve just posted a similar post at Leiter Reports.)
Suppose you’d like a job in a top research university. (Lots of people want that; lots of people don’t; that’s fine; different metrics are relevant for different people.) What’s an objective measure of “top”? A crude one might be “has a PhD program”. A better one might be “has a PhD program that places lots of people”. Better still: “has a PhD program that places lots of people in places with a PhD program”. Better still: “has a PhD program that places lots of people in places whose PhD program places lots of people in places with PhD programs”. And so on.
This is actually a pretty close cousin to the problem that Google faced when it set up in the 90s. There, the problem is to identify the most important websites. A first approximation might be that the most important sites are those which are most often linked to. A better approximation: the most important sites are those often linked to by other sites that are themselves often linked to. And so on.
Google’s PageRank algorithm is a lovely bit of linear algebra that solves this problem (I won’t try to summarise it; there are lots of discussions on the internet.) So we could just apply it to the APDA placement data. There are some conceptual and practical problems with that:
1) PageRank makes an allowance for the size of the department in which the placement happens that doesn’t really make sense in this context (but whose effect isn’t large, I think).
2) the APDA data doesn’t (in my view) allow optimally for postdocs (at least for research-focused careers), for the reasons discussed here and at DN. (But in any case, as Caroline notes above, the dataset probably includes postdocs.)
3) I don’t have access to the raw APDA data; I’m drawing from a version of the dataset used for the network graphs but there are some features of it I’m not 100% sure about.
But never mind! – this is a blog comment, not a research paper. If we throw caution to the winds, we can apply PageRank and obtain (what we might call) a Placement Quality Rank (PQR) from the 2012 data. In order, the top PQR departments are: NYU, Columbia, Princeton, Yale, Leuven, UC Berkeley, Oxford, Rutgers, Pittsburgh (HPS), Toronto.
So: suppose you were a bright undergraduate in 2006, hoping to get a job at a department with a high PQR. Where do you apply? Ideally, a high-PQR department. But the PQR is calculated from 2012-2016 data; you can’t work it out for ten years. So you could make lots of visits, look at information on the web, ask your undergraduate professors, try to talk to current students, etc.
Or you could look at the 2006-2008 PGR, which is a pretty impressive predictor of 2012-2016 PQR. Specifically (and restricting attention to the US):
– all but one of the top-thirty PQR departments is a top-thirty PGR department. (The exception is Penn State, PQR=29, which wasn’t ranked by the 2006-2008 PGR.)
– 11 of the 31-50 ranked PQR departments are also PGR-ranked.
– Within the 29 top-thirty PQR departments that are also PGR-ranked, the correlation between PQR rank and PGR rank is +0.75, which in the social sciences is about as good as it gets.
The original idea of PGR is that peer assessment of faculty quality is the best forward-looking predictor of placement (placement itself being backward-looking, so that the placement data an undergraduate sees is very out of date by the time they get to grad school.) I have to say that on this quick analysis, the APDA data bears that out pretty well: there is at least one objectively-definable, fairly natural measure of placement record (fairly natural for people hoping for a job in a research university, at any rate; it’s less natural for someone looking for a teaching-oriented job) which was really well approximated by the appropriate PGR, whatever the causal mechanisms for that might be.
Well, if it was a predictor only because it was a causal agent, it would have to continue to be a causal agent for this decision to make sense.
P.s. My name is Carolyn
Sorry!
(I know that, but I was obviously typing on autopilot.)
Gotcha. No worries.
Damn. Sorry! (I know that; I was obviously typing on autopilot.)
Well, of course.
But
(a) there are various axes on which to assess the PGR. One concern might be that it doesn’t actually measure the thing it purports to do; that’s the one to which I think your data speaks. (Consider that if I had found a very *weak* correlation between PQ rank and PGR rank, it would have been quite significant evidence that graduate applicants should *not* use the PGR, and could legitimately have been quoted by PGR critics.
(b) PGR rank in 2006-8 correlates fairly well with PGR rank in 2014. So if some shift in causal mechanisms means that PGR rank is not going to be predictive of future placement from now on, there’s going to have to be quite a big shift in hiring patterns in the next few years. In which case present placement data will also not be predictive of future placement data.
(Sorry, that was supposed to follow Carolyn’s comment about causal agents.)
I don’t think b is true, because your analysis is mostly about where people get jobs from specific programs, not how many they get from those programs. Obviously the latter could be rigid while the former shifts.
As for the earlier comment–if we ever create a true rankings (these were called “lists” in our report), I think it would make sense to have them be customizable, as you suggest, but as I also suggested years ago: http://www.newappsblog.com/2014/07/an-ideal-ranking.html
Thank you so much for doing this!
Thanks for the positive feedback! 🙂
As someone who would have been happy in a teaching-intensive or research-intensive TT job, and who now will probably secure neither, I certainly would have liked to have had this information before going to grad school. The nonsense about prestigious jobs versus non-prestigious jobs seems quite tone deaf to me, given the current state of the job market.
It’s good to hear that you find it helpful.
Seconded. Acceptance to Harvard, NYU, Oxford or Columbia is indeed a ticket to an incestuous little prestige-placement network. Why is this relevant to 90% of prospective grads, given the state of the market? Totally unclear.
For Dave Chalmers, David Wallace, and others who might be interested: http://philosophydata.org has the placement data (but a newer pull–from yesterday) broken down into more categories (including postdocs)–see the first two linked pages, which have the same data organized differently (sorted chart versus sortable table).