
2023 Philosophy Primary Job Cycle Report (guest post)
What did the Fall 2023 philosophy job market look like?
Here with a report is Charles Lassiter (Gonzaga University), who has gathered and analyzed the data.
(A version of this post first appeared at Professor Lassiter’s site.)

2023 Philosophy Primary Job Cycle Report
by Charles Lassiter
Hello again, friends! The numbers are in. Let’s take a gander at the philosophy job market this past cycle. As a reminder, I define “primary cycle” as running from July to December. Let’s start with the overall picture.
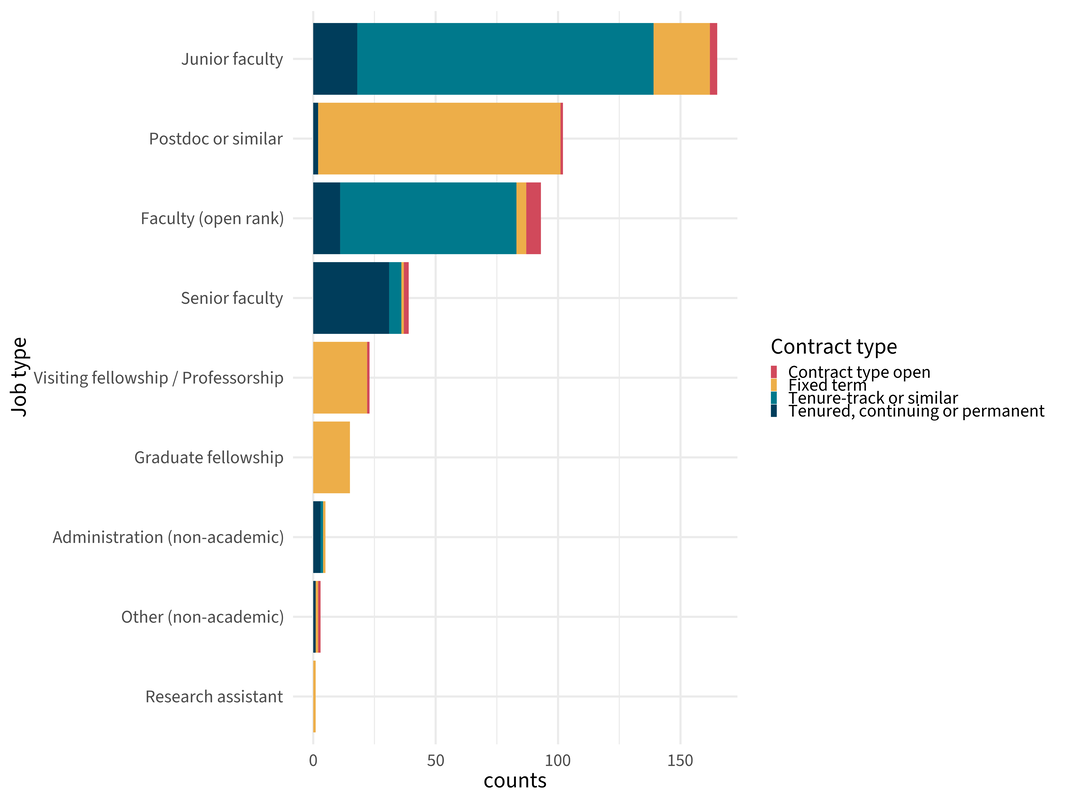
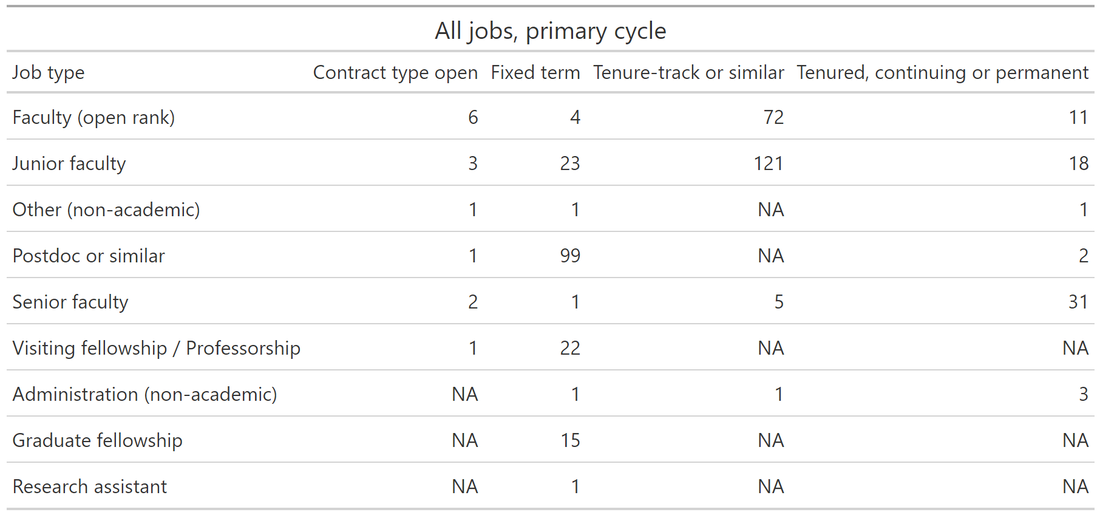
The biggest groups were tenure-track and postdoc, followed by open rank hires. Here are the numbers for each.
Now for the historical perspective. The heavy solid lines are the regression.
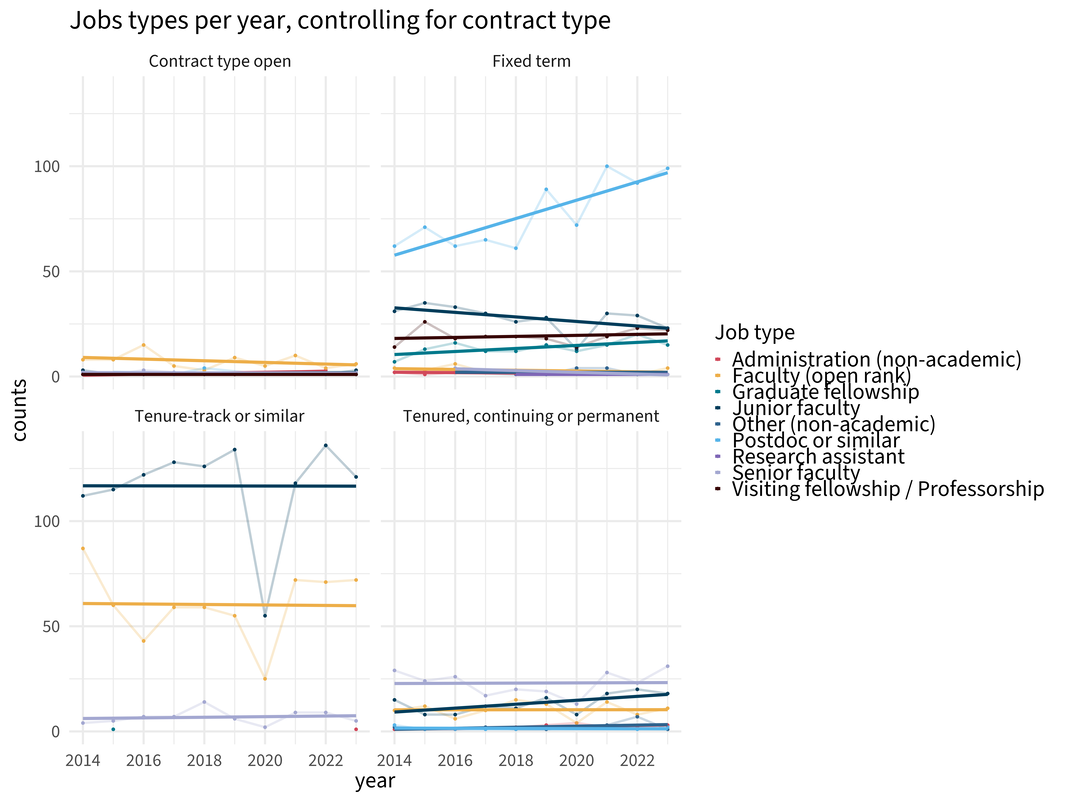 Some depressing info here. For the primary job cycle, tenure-track jobs for junior faculty have shown no growth since 2014. But things look different if we leave out 2020. (More on that below.) Excluding that awful awful year, tenure-track jobs trend upwards. Huzzah!
Fixed-term junior jobs are trending slightly downwards. But given what the data suggest about more fixed-term jobs being advertised in the secondary cycle, this isn’t too surprising.
What jobs are rising most quickly? Postdocs. That’s good news for freshly-minted PhDs as far as paying next month’s rent, but those jobs are for a limited time only. Additionally, it’s no secret that postdoc gigs tend to be relatively low-pay for high-labor. Some postdocs are pushing back. (That article looks at science postdocs and not philosophy ones. If readers want to chime in with their experiences, please do.) One explanation is that more stable and high-paying jobs are being replaced by postdocs, which saves universities a lot of scratch—the research version of relying on adjuncts to meet demand.
Finally, let’s take a look at junior positions over time.
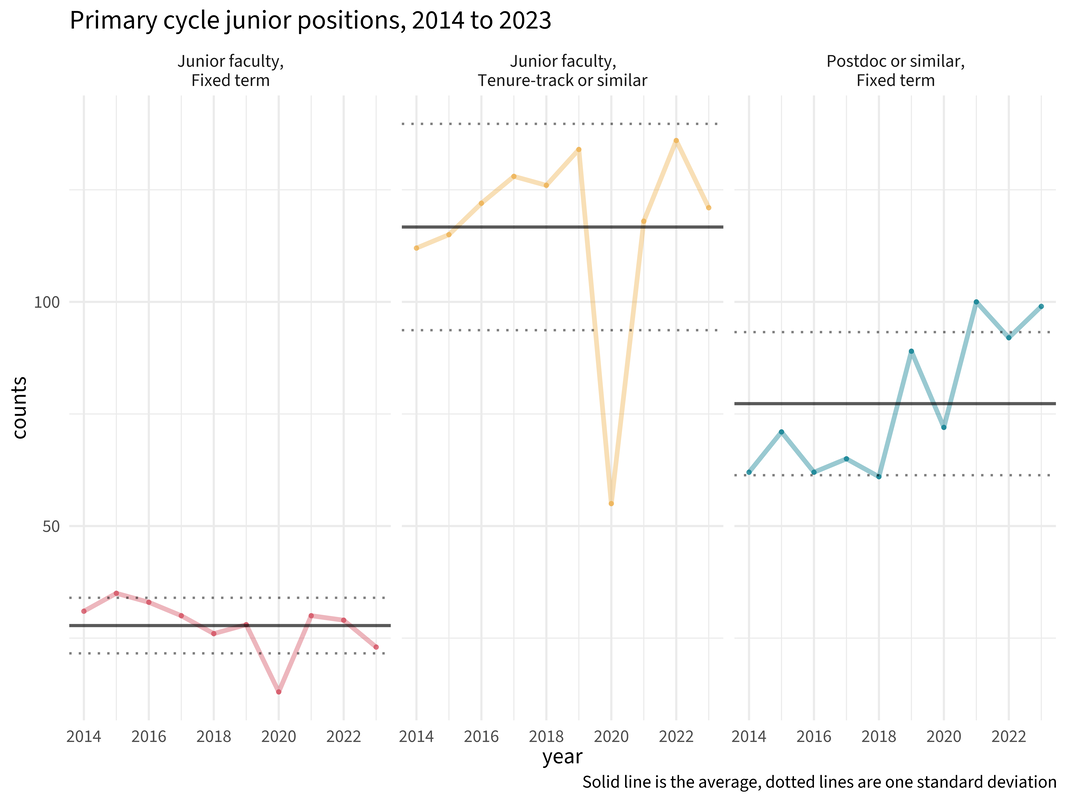
Fixed term and tenure-track junior positions are below and above average (respectively) but still within one standard deviation. But what if we exclude 2020 as an outlier? Here’s what we see:
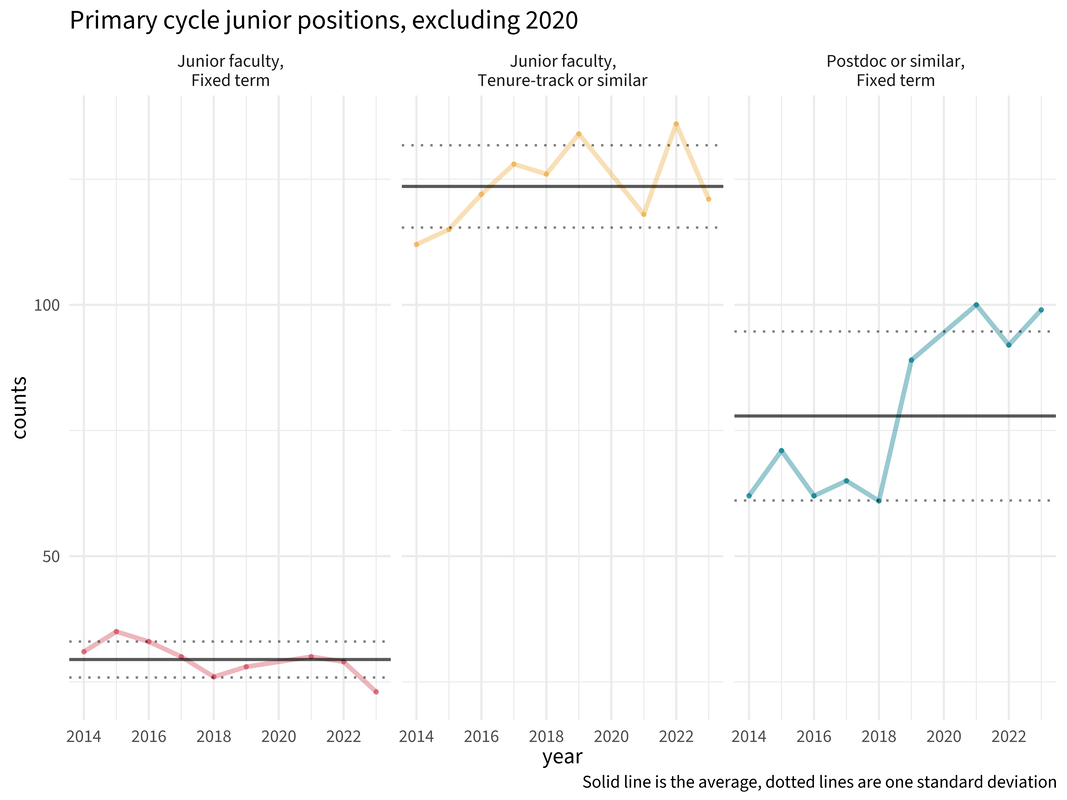
Tenure-track jobs did unusually well in 2019 and 2022 primary cycles, and 2023 is below average but not terribly so. Fixed term is lower by one SD and postdocs are higher by one SD—both of which, I think, are concerning trends even with this more optimistic view of the market.
So what to conclude? I think the big question is, should 2020 be excluded from the data as an outlier? Doing so gives a rosier view of the market. However my own hunch is to say “no,” and not just because I haven’t had my afternoon coffee. An oft-shared joke on social media is that we’re experiencing once-in-a-lifetime events more frequently. The recession of 2007-2009 hit the market hard. Just over a decade later, COVID hit the market hard again. It is, of course, a challenge to predict global catastrophes, but there will surely be more as the effects of climate change are felt more acutely. As a matter of personal preference, given the choice of being optimistic or guarded about the future of the philosophy job market, I play it conservative.
Still, I’m open to arguments that 2020 really is an outlier and can be (relatively) safely excluded.
That’s all. Thanks, as always, for reading. If there are other analyses you’d like to see, please let me know!
(Note to my fellow R users: If you want to start playing with new color palettes, try out coolors.co. It has some great tools, and it’s how I got the colors for these plots. And if you want to try out new fonts (these plots use Source Sans 3 from Google), this is a great guide.)

Is this for US jobs only, or whatever was advertised on PhilJobs?
If the latter, then I wonder whether part of the equation may be that more and more European places post on PhilJobs, where Postdocs have been the norm and driving force of major research universities for years if not decades.
thanks for the question. The data from PhilJobs show that North America has posted more postdoc positions than Europe since 2014, but it seems like Europe’s employment of postdocs is happening at a slightly faster rate than North America. If there is data about postdocs in Europe not included in PhilJobs, then it’s not in the analysis.
Thanks. I’m not aware of any data collection in the European segment of the market, just know from experience that a lot of (by far, the majority of) European postdocs are not listed on philjobs. Except now some countries / universities are starting, at least occasionally, to list them.
Is there a central website where many/most are advertised, or do different countries do their own thing?
Grad Student
Europe is not centralized. Indeed, each country has its own practices around hiring etc. in the academiy. You really have to have your ear to the ground, or tap into the various resources in specific countries where you might want to work. Often post doc positions are advertised quite widely, and in USA venues because they do not expect you to know the national language. But for many jobs they do.
Okay, thanks a lot.
I am an advocate of the viridis package because it is supposed to be perceptually uniform and robust to colorblindness.
https://cran.r-project.org/web/packages/viridis/vignettes/intro-to-viridis.html
agreed, but (IMHO) viridis works well with denser scatterplots and maps. I find that if i need just two or three colors, the first few in the palette don’t show up well against light or dark backgrounds
Fair points! To be clear I think the graphs look to my (non-colorblind) eyes. The only one I’m a bit worried about is the bar graph. But I more want to—admittedly it’s a digression—raise a concern with palettes given by that site!
You can make the color scale range smaller by adding something like [the begin and end parameters]: scale_color_viridis(discrete = TRUE, option = “plasma”, begin = 0.6, end = 0.9).
I would suggest counting 2020 differently for permanent positions than for temporary positions.
For permanent positions, many schools opted not to try to do a job search in 2020, and instead delayed that search to one of the following years. So the net effect will be a sort of “crater” in the data with some rubble thrown from 2020 to boost the following years, which should all balance out in your linear fits.
For temporary positions, there’s less reason to think they would have been delayed to be hired in a later year — instead those position-years were probably just lost — so I’d suggest eliminating 2020 as an aberration.
Thanks for doing this and making it available. In a post here a couple of weeks ago (“The Demand for Philosophers”), Justin Weinberg had this to say:
How does that square with what you’ve said here about the slight upward trend in TT jobs since 2014? Does starting from 2014 make that much difference, or are you and Justin using different datasets?