
Demographic Trends in the US Philosophy Major, 2001-2022 (guest post)
How many philosophy majors are there, who are they, and how has this changed over the past twenty years?
In the following guest post, Eric Schwitzgebel (UC Riverside) shares some data on these matters.
A version of this post was originally published at The Splintered Mind.

[Alfredo Hilto, “Curves and Straight Series” (edit)]
Demographic Trends in the U.S. Philosophy Major, 2001-2022 — Including Total Majors, Second Majors, Gender, and Race
by Eric Schwitzgebel
I’m preparing for an Eastern APA session on the “State of Philosophy” this Thursday, and I thought I’d share some data on philosophy major bachelor’s degree completions from the National Center for Education Statistics IPEDS database, which compiles data on virtually all students graduating from accredited colleges and universities in the U.S., as reported by administrators.
I examined all data from the 2000-2001 academic year (the first year in which they started recording data on second majors) through 2021-2022 (the most recent available year).
Total Numbers of Philosophy Majors: The Decline Has Stopped
First, the sharp decline in philosophy majors since 2013 has stopped:
| 2001: 5836 |
| 2002: 6529 |
| 2003: 7023 |
| 2004: 7707 |
| 2005: 8283 |
| 2006: 8532 |
| 2007: 8541 |
| 2008: 8778 |
| 2009: 8996 |
| 2010: 9268 |
| 2011: 9292 |
| 2012: 9362 |
| 2013: 9427 |
| 2014: 8820 |
| 2015: 8184 |
| 2016: 7489 |
| 2017: 7572 |
| 2018: 7667 |
| 2019: 8074 |
| 2020: 8209 |
| 2021: 8328 |
| 2022: 7958 |
(The decline between 2021 and 2022 reflects a general decline in completions of bachelor’s degrees due to the pandemic that year, rather than a trend specific to philosophy.)
In general, the humanities have declined sharply since 2010, and history, English, and foreign languages and literature continue to decline. This graph shows the trend:
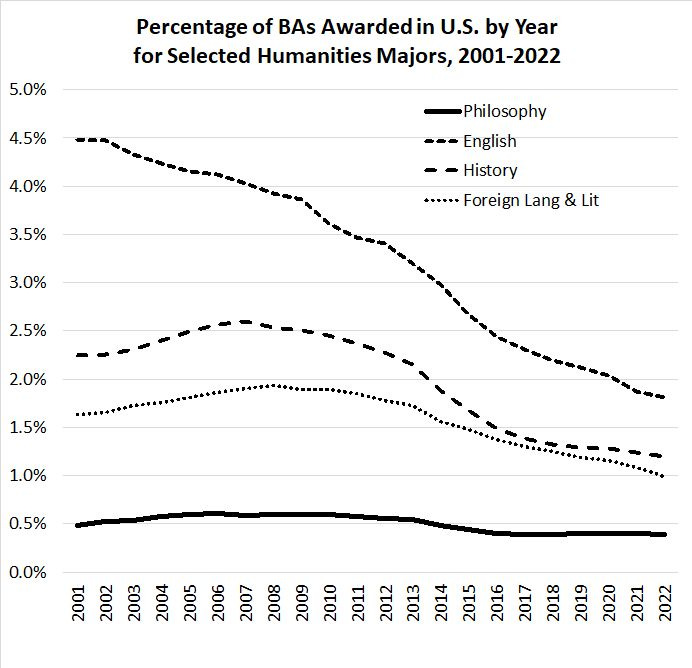
The decline in the English major is particularly striking, from 4.5% of bachelor’s degrees awarded in 2000-2001 to 1.8% in 2021-2022. Philosophy peaked at 0.60% in 2005-2006 and has held steady at 0.39%-0.40% since 2015-2016.
Philosophy Relies on Double Majors
Breaking the data down by first major vs second major, we can see that over time an increasing proportion of students have philosophy as their second major. In the 2021-2022 academic year, 24% of students who took a bachelor’s degree in philosophy had it listed as their second major.
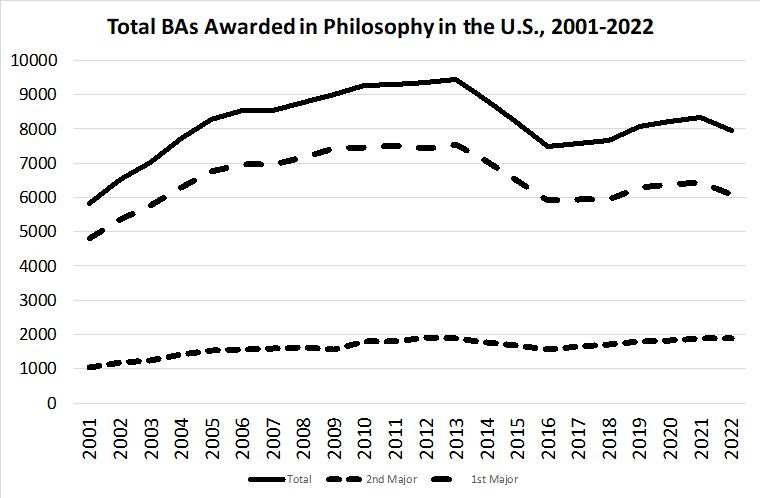
It’s impossible to know what percentage of students who took philosophy as their first major also carried a second major. However, a ballpark estimate might assume that about half of students with philosophy plus one other major list philosophy first rather than second. If so, then approximately half of all philosophy majors (48%) are double majors.
The ease of double majoring is likely to influence the number of students who choose philosophy as a major.
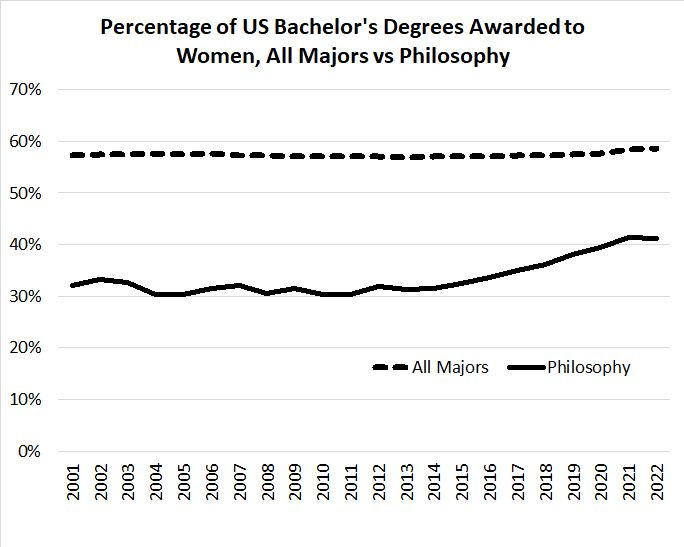
Gender Disparity Is Decreasing
NCES classifies all students as men or women, with no nonbinary category and no unclassified students. Since the beginning of the available data in the 1980s through the mid-2010s, the percentage of women among philosophy bachelor’s recipients hovered steadily between 30% and 34%, not changing even as the total percentage of women increased from 51% to 57%. However, the last several years have seen a clear decrease in gender disparity, with women now earning 41% of philosophy degrees.
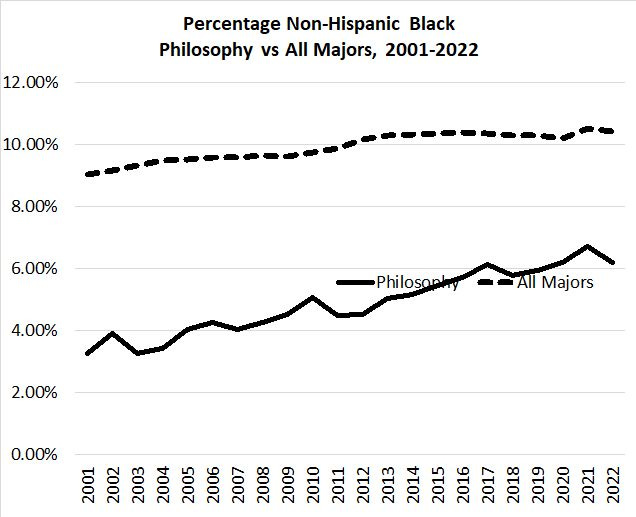
Black Students Remain Underrepresented in Philosophy Compared to Undergraduates Overall, and Other Race/Ethnicity Data
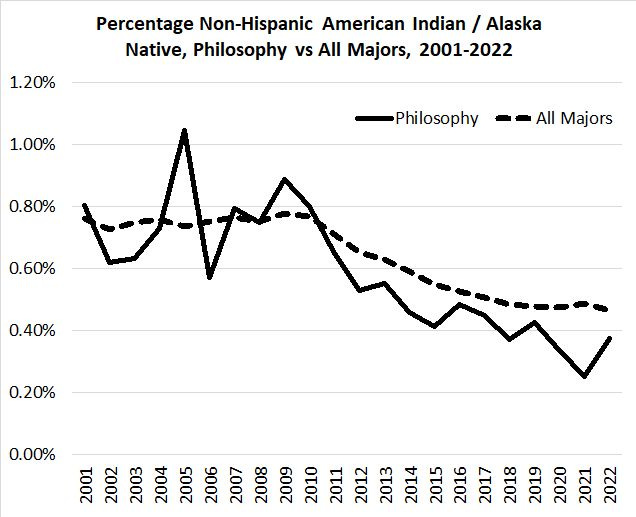
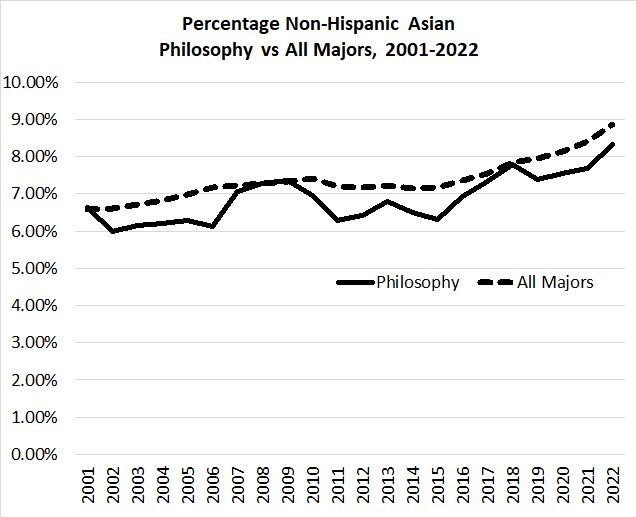
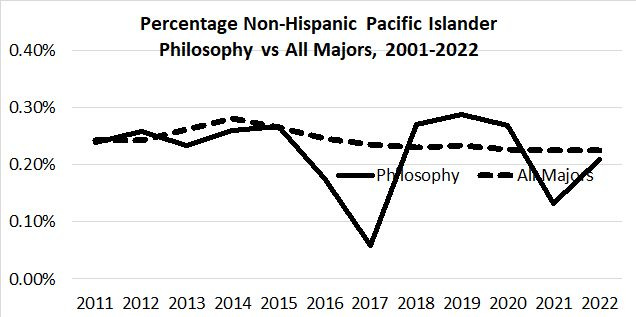
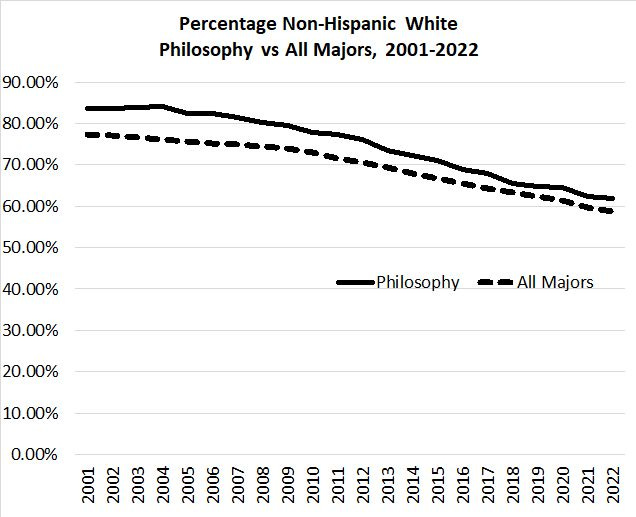
NCES uses the following race/ethnicity categories: U.S. nonresident, race/ethnicity unknown, Hispanic or Latino (any race), and among U.S. residents who are not Hispanic or Latino: American Indian or Alaska Native, Asian, Black or African American, Native Hawaiian or Other Pacific Islander, White, and two or more races. Before 2007-2008, Native Hawaiian or Other Pacific Islander was included with Asian, but inconsistently until 2010-2011. The two-or-more races option was also introduced in the 2007-2008 academic year, again with inconsistent reporting for several years.
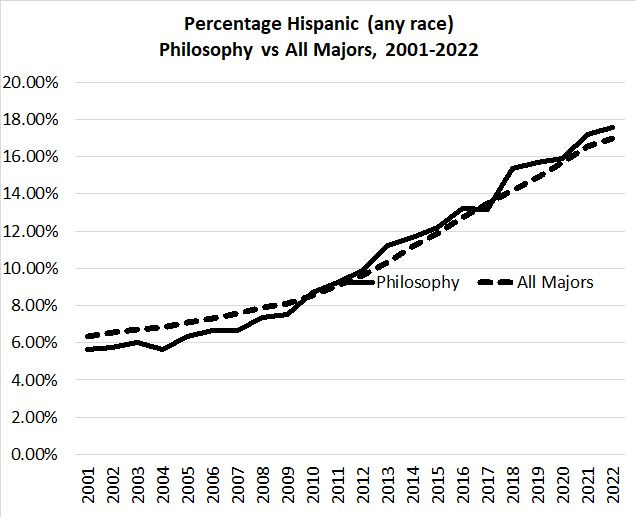
I’ve charted these categories below. As you can see, for most categories, the percentages are similar for philosophy and for graduates overall, except that non-Hispanic White is slightly higher for philosophy and non-Hispanic Black significantly lower. In 2021-2022, non-Hispanic Black people were 14% of the U.S. population age 18-24, 10% of bachelor’s degree recipients, and 6% of philosophy bachelor’s recipients.
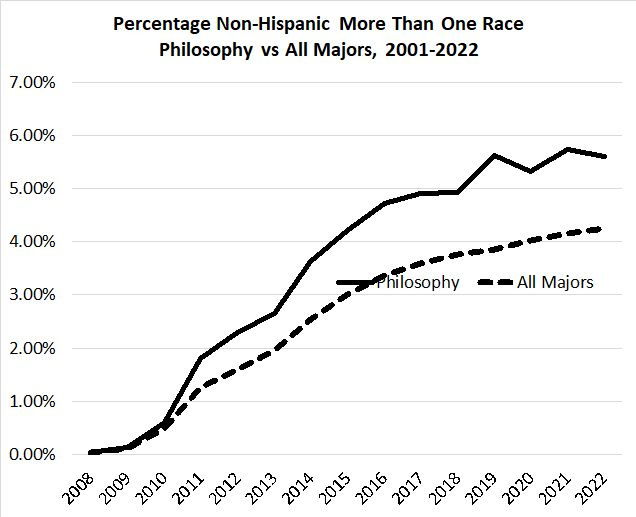
I interpret the sharp increase in multi-racial students as reflecting reporting issues and an increasing willingness of students to identify as multi-racial.
It’s also worth noting that although philosophy majors are approximately as likely to be Hispanic/Latino as graduates overall, Hispanic/Latino students are underrepresented among bachelor’s degree recipients relative to the U.S. population age 18-24 (17% vs 23%). Non-Hispanic American Indian / Alaska Native students are also underrepresented among overall graduates (0.5% vs. 0.8% of the population age 18-24).
“However, a ballpark estimate might assume that about half of students with philosophy plus one other major list philosophy first rather than second. If so, then approximately half of all philosophy majors (48%) are double majors.” In my experience, a large majority of students with philosophy plus one other major list philosophy second. Admittedly, my experience may not be representative. However, my department has a fair number of students interested in legal careers who double major in philosophy and political science. (We incentivize this, via a scheme that I created as chair, by allowing students to double count certain courses toward both majors.) If students list philosophy first then their degree with be a B.A. If they list political science first then it will be, or at least can be, a B.S. So challenging do students find the extra year of foreign language required for the B.A. that they nearly all list political science first.
Same at my university. Nearly all philosophy double-majors are second majors, to avoid the foreign language requirement by having a primary BS.
Could some kind person point me towards sources of data on a related subject: historical trends in the number of teachers of philosophy in the US? No doubt there is room for debate about definitions; all I’m looking for is a rough indication of changes in the number of professional philosophers since the early 20th century, ideally going back to the 1930s or 1940s.