
Percent of U.S. Philosophy PhD Recipients Who Are Women: A 50-Year Perspective (guest post) (updated)
Has there been a recent uptick in the percentage of women among philosophy PhD recipients?
It’s tricky to assess, says Eric Schwitzgebel (UC Riverside), in the following guest post.
(A version of this post first appeared at The Splintered Mind.)

[painting by María Freire]
Percent of U.S. Philosophy PhD Recipients Who Are Women: A 50-Year Perspective
by Eric Schwitzgebel
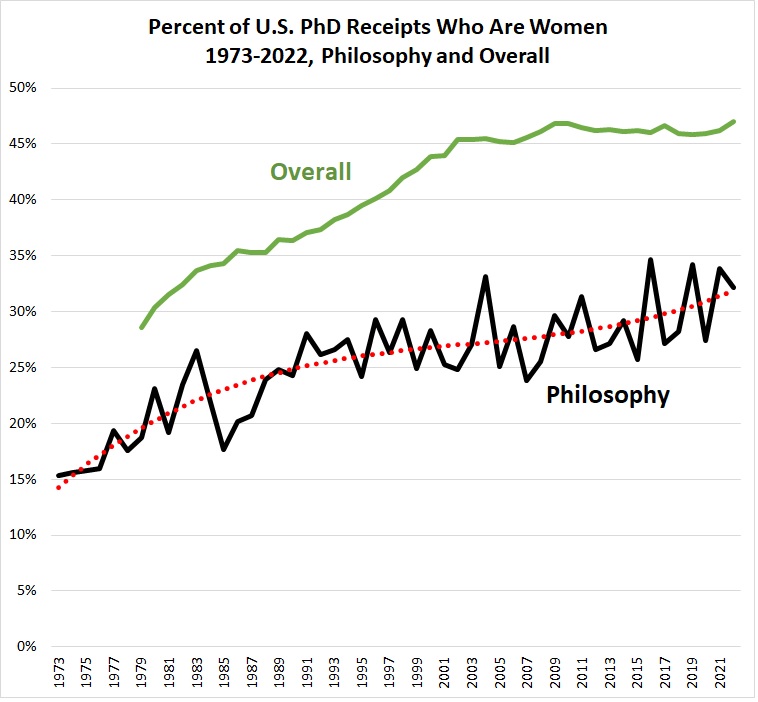
In the 1970s, women received about 17% of PhDs in philosophy in the U.S. The percentage rose to about 27% in the 1990s, where it stayed basically flat for the next 25 years. The latest data suggest that the percentage is on the rise again.
Here’s a fun chart (for user-relative values of “fun”), showing the 50-year trend. Analysis and methodological details to follow.
The data are drawn from the National Science Foundation’s Survey of Earned Doctorates through 2022 (the most recent available year). The Survey of Earned Doctorates aims to collect data on all PhD recipients from accredited universities in the United States, generally drawing response rates over 90%. The SED asks one binary question for sex or gender: “Are you male or female?”, with response options “Male” and “Female”. Fewer than 0.1% of respondents are classified in neither category, preventing any meaningful statistical analysis of nonbinary students.
Two facts are immediately obvious from this chart:
First, women have persistently been underrepresented in philosophy compared to PhDs overall.
Second, women receive fewer than 50% of PhDs overall in the U.S. Since the early 2000s, the percentage of women among PhD recipients across all fields has been about 46%. Although women have consistently been earning about 57-58% overall of Bachelor’s degrees since the early 2000s, disproportionately few of those women go on to receive a PhD.
The tricky thing to assess is whether there has been a recent uptick in the percentage of women among Philosophy PhD recipients. The year-to-year variability of the philosophy data (due to a sample size of about 400-500 PhD recipients per year in recent years) makes it unclear whether there’s any real recent underlying increase that isn’t just due to noise. I’ve drawn a third-degree polynomial trendline through the data (the red dots), but there’s a risk of overfitting.
In a 2017 article, Carolyn Dicey Jennings and I concluded that the best interpretation of the data through 2014 was that the percentage of women philosophy PhD recipients hadn’t changed since the 1990s. The question is whether there’s now good statistical evidence of an increase since then.
One simple approach to the statistical question is to look for a correlation between year and percentage of women. For the full set of data since 1973, there’s a strong correlation: r = .82, p < .001—very unlikely to be statistical chance. There’s also a good correlation if we look at the span 1990-2022: r = .49, p = .004.
Still, the chart looks pretty flat from about 1990 (24.3%) to about 2015 (25.7%). If most of the statistical work is being done by three high years near the end of the data (2016: 34.7%; 2019: 34.2%; 2021: 33.8%), the best model might not be a linear increase since 1990 but something closer to flat for most of the 1990s and early 2000s, with the real surge only in the most recent several years.
To pull more statistical power out of the data to examine a narrower time period, I treated each PhD recipient as one observation: year of PhD and gender (1 = female, 0 = not female), then ran an individual-level correlation for the ten-year period 2013-2022. The correlation was statistically significant: r = .032, p = .029. (Note that r values for disaggregated analyses like this will seem low to people used to interpreting r values in other contexts. Eyeballing the chart is a better intuitive assessment of effect size. The important thing is that the low p value [under the conventional .05] suggests that the visually plausible relationship between year of PhD and gender in the 2013-2022 period is not due to chance.)
Since this is a post-hoc analysis, and a p-value of .029 isn’t great, so it makes sense to test for robustness. Does it matter that I selected 2013 in particular as my start date? Fortunately, we get similar results choosing 2012 or 2014 as the start years, though for 2014 the result is only marginally statistically significant (respectively, r = .037, p = .008; r = .026, p = .099).
Another approach is to bin the data into five-year periods, to smooth out noise. If we create five-year bins for the past twenty years, we see:
1993-1997: 27% women (453/1687)
1998-2002: 27% (515/1941)
2003-2007: 27% (520/1893)
2008-2012: 28% (632/2242)
2013-2017: 29% (701/2435)
2018-2022: 31% (707/2279)
Comparing all the bins pairwise, 2018-2022 is a statistically significantly higher proportion of women than the bins from 1993-2012 and statistically marginally higher than 2013-2017 (p values: .004, .001, .012, .037, .094, respectively). No other pairwise comparisons are significant.
I don’t think we can be confident. Post-hoc analyses of this sort are risky—one can see patterns in the noise, then unintentionally p-hack them into seeming real. But the fact that the upward recent trend comes across in two very different analyses of the data and passes a robustness check inclines me to think the effect is probably real.
[1] “Philosophy” has been a “subfield” or “detailed field” in the SED data from at least 1973. From 2012-2020, the SED also had a separate category for “Ethics”, with substantially fewer respondents than the “Philosophy” category. For this period, both “Ethics” and “Philosophy” are included in the analysis above. Starting in 2021, the SED introduced a separate category for “History / philosophy of science, technology, and society”. Respondents in this category are not included in the analysis above. Total “Philosophy” PhD recipients dropped about 15% from 2019 and 2020 to 2021 and 2022, which might partly reflect a loss to this new category of some respondents who would otherwise have been classified as “Philosophy” — but might also partly be noise, partly long-term trends, partly pandemic-related short-term trends.
UPDATE: A reader writes in with a criticism:
Schwitzgebel’s post today is somewhat misleading: the Survey of Earned Doctorates includes everyone who earns (what they consider) a research doctorate, including not just PhDs but also EdDs, Doctors of Arts, Doctors of Theology, and so on. However, the survey excludes professional doctorates like MDs, JDs, DDSs, and PsyDs: https://ncses.nsf.gov/pubs/