
Data on Diversity in (mostly) US Philosophy
The American Philosophical Association (APA) has released a new report on its membership demographics over the past three years. Has philosophy become more demographically diverse during this period? It’s not easy to tell from the data.
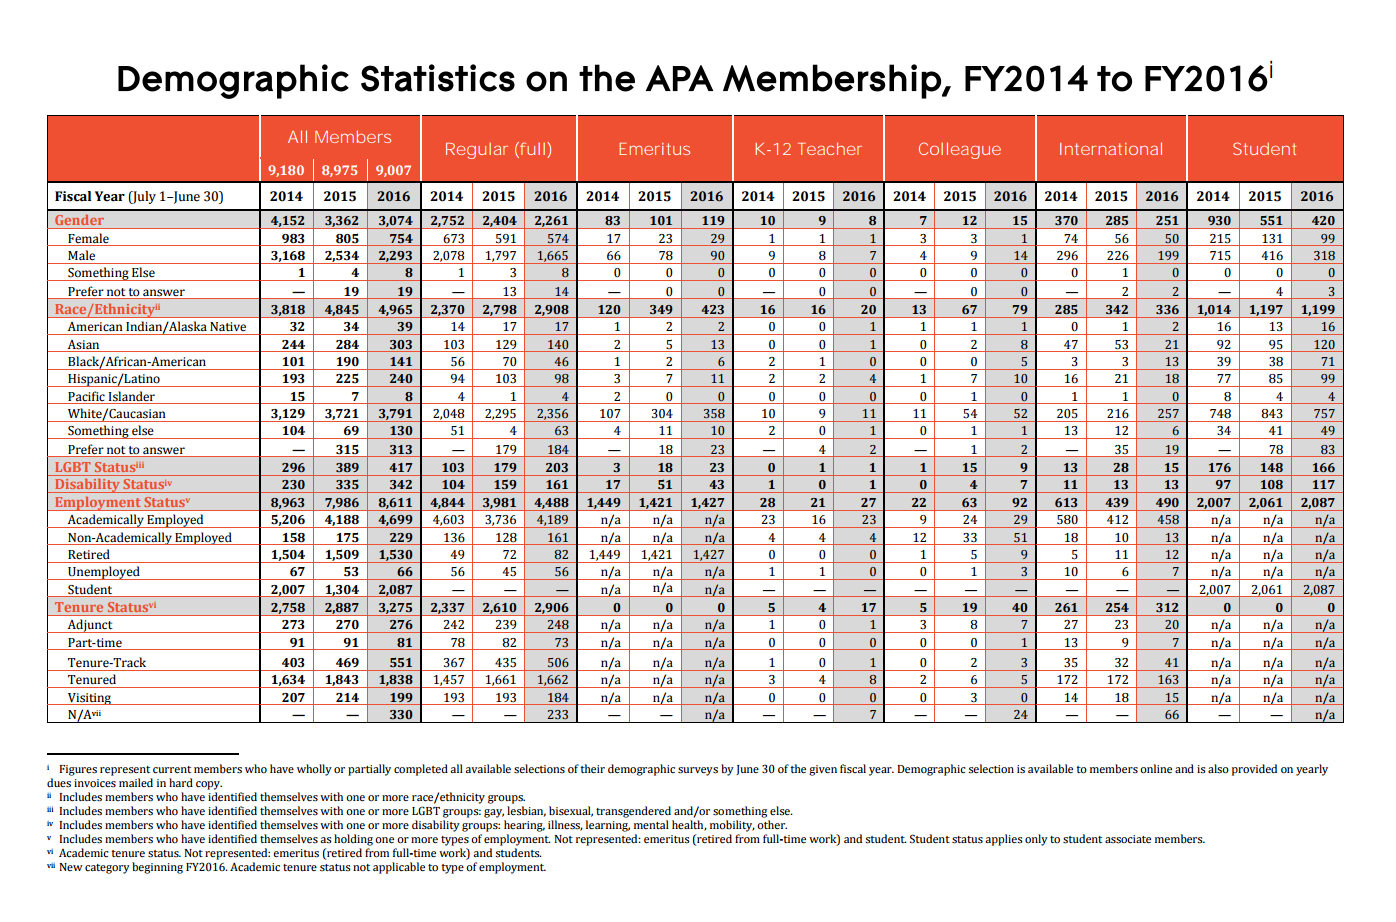
(PDF version here.)
The picture is complicated owing to the change in the percentage of people answering each of the questions from year to year.

It would have been more helpful if you had analysed this data and given us some conclusions!
It’s not easy to tell, no, but there’s no reason it shouldn’t be a little easier.
I turned the data into a spreadsheet [1], which has the original data first – in case anyone with statistical expertise wants to analyze it – and then the data expressed in terms of percentages of those who answered each demographic question. Most of this was handled automatically, and I haven’t checked it, so there may well be errors. There may also be lacunas in the original data – the tenure status categories for 2014 don’t add up to 100%, for instance.
From a quick inspection, a few things stand out to my inexpert eye: (A) reporting of gender among all members and among student members stayed roughly constant from 2014-2016 (~75% “Male”, ~25% “Female”); (B) there’s an apparent drop in respondents indicating “White/Caucasian” among all members from 2014-2016 (82% to 76%), but it seems to correspond to those who preferred not to answer when that became an option in 2015 (~6%); (C) the student contingent taken by itself, however, chose “White/Caucasian” less in 2016 (63%) than in either 2015 (70%) or 2014 (74%), with about the same proportion of students preferring not to answer as among all members in 2015 and 2016 (~7%).
[1] https://www.dropbox.com/s/0iz5690ohwpmd27/APA%20Demographics.xlsx?dl=0
Given that faculty careers last decades, and even graduate student cohorts take at least 5 or 6 years to turn over, it would be very surprising if there were any large changes in just three years! There might be a few suggestive trends, but my guess is that unless there’s a huge spike of some sort, we won’t have a clear idea about overall changes until these data have been collected for at least a decade. Great that it’s been started now, and too bad it wasn’t started a decade or two earlier!