
Trends in Philosophy Hiring by Area of Specialization
Aero Data Lab, “a collaboration of scientists, ethicists, and policy-makers interested in improving the quality of the clinical research enterprise,” has published an analysis of trends in the academic philosophy job market over the past six years.
The analysis, by Spencer Hey (Harvard Medical School, Brigham and Women’s Hospital), tracks changes in the number of academic positions advertised for different areas of specialization in philosophy, based on data from PhilJobs.
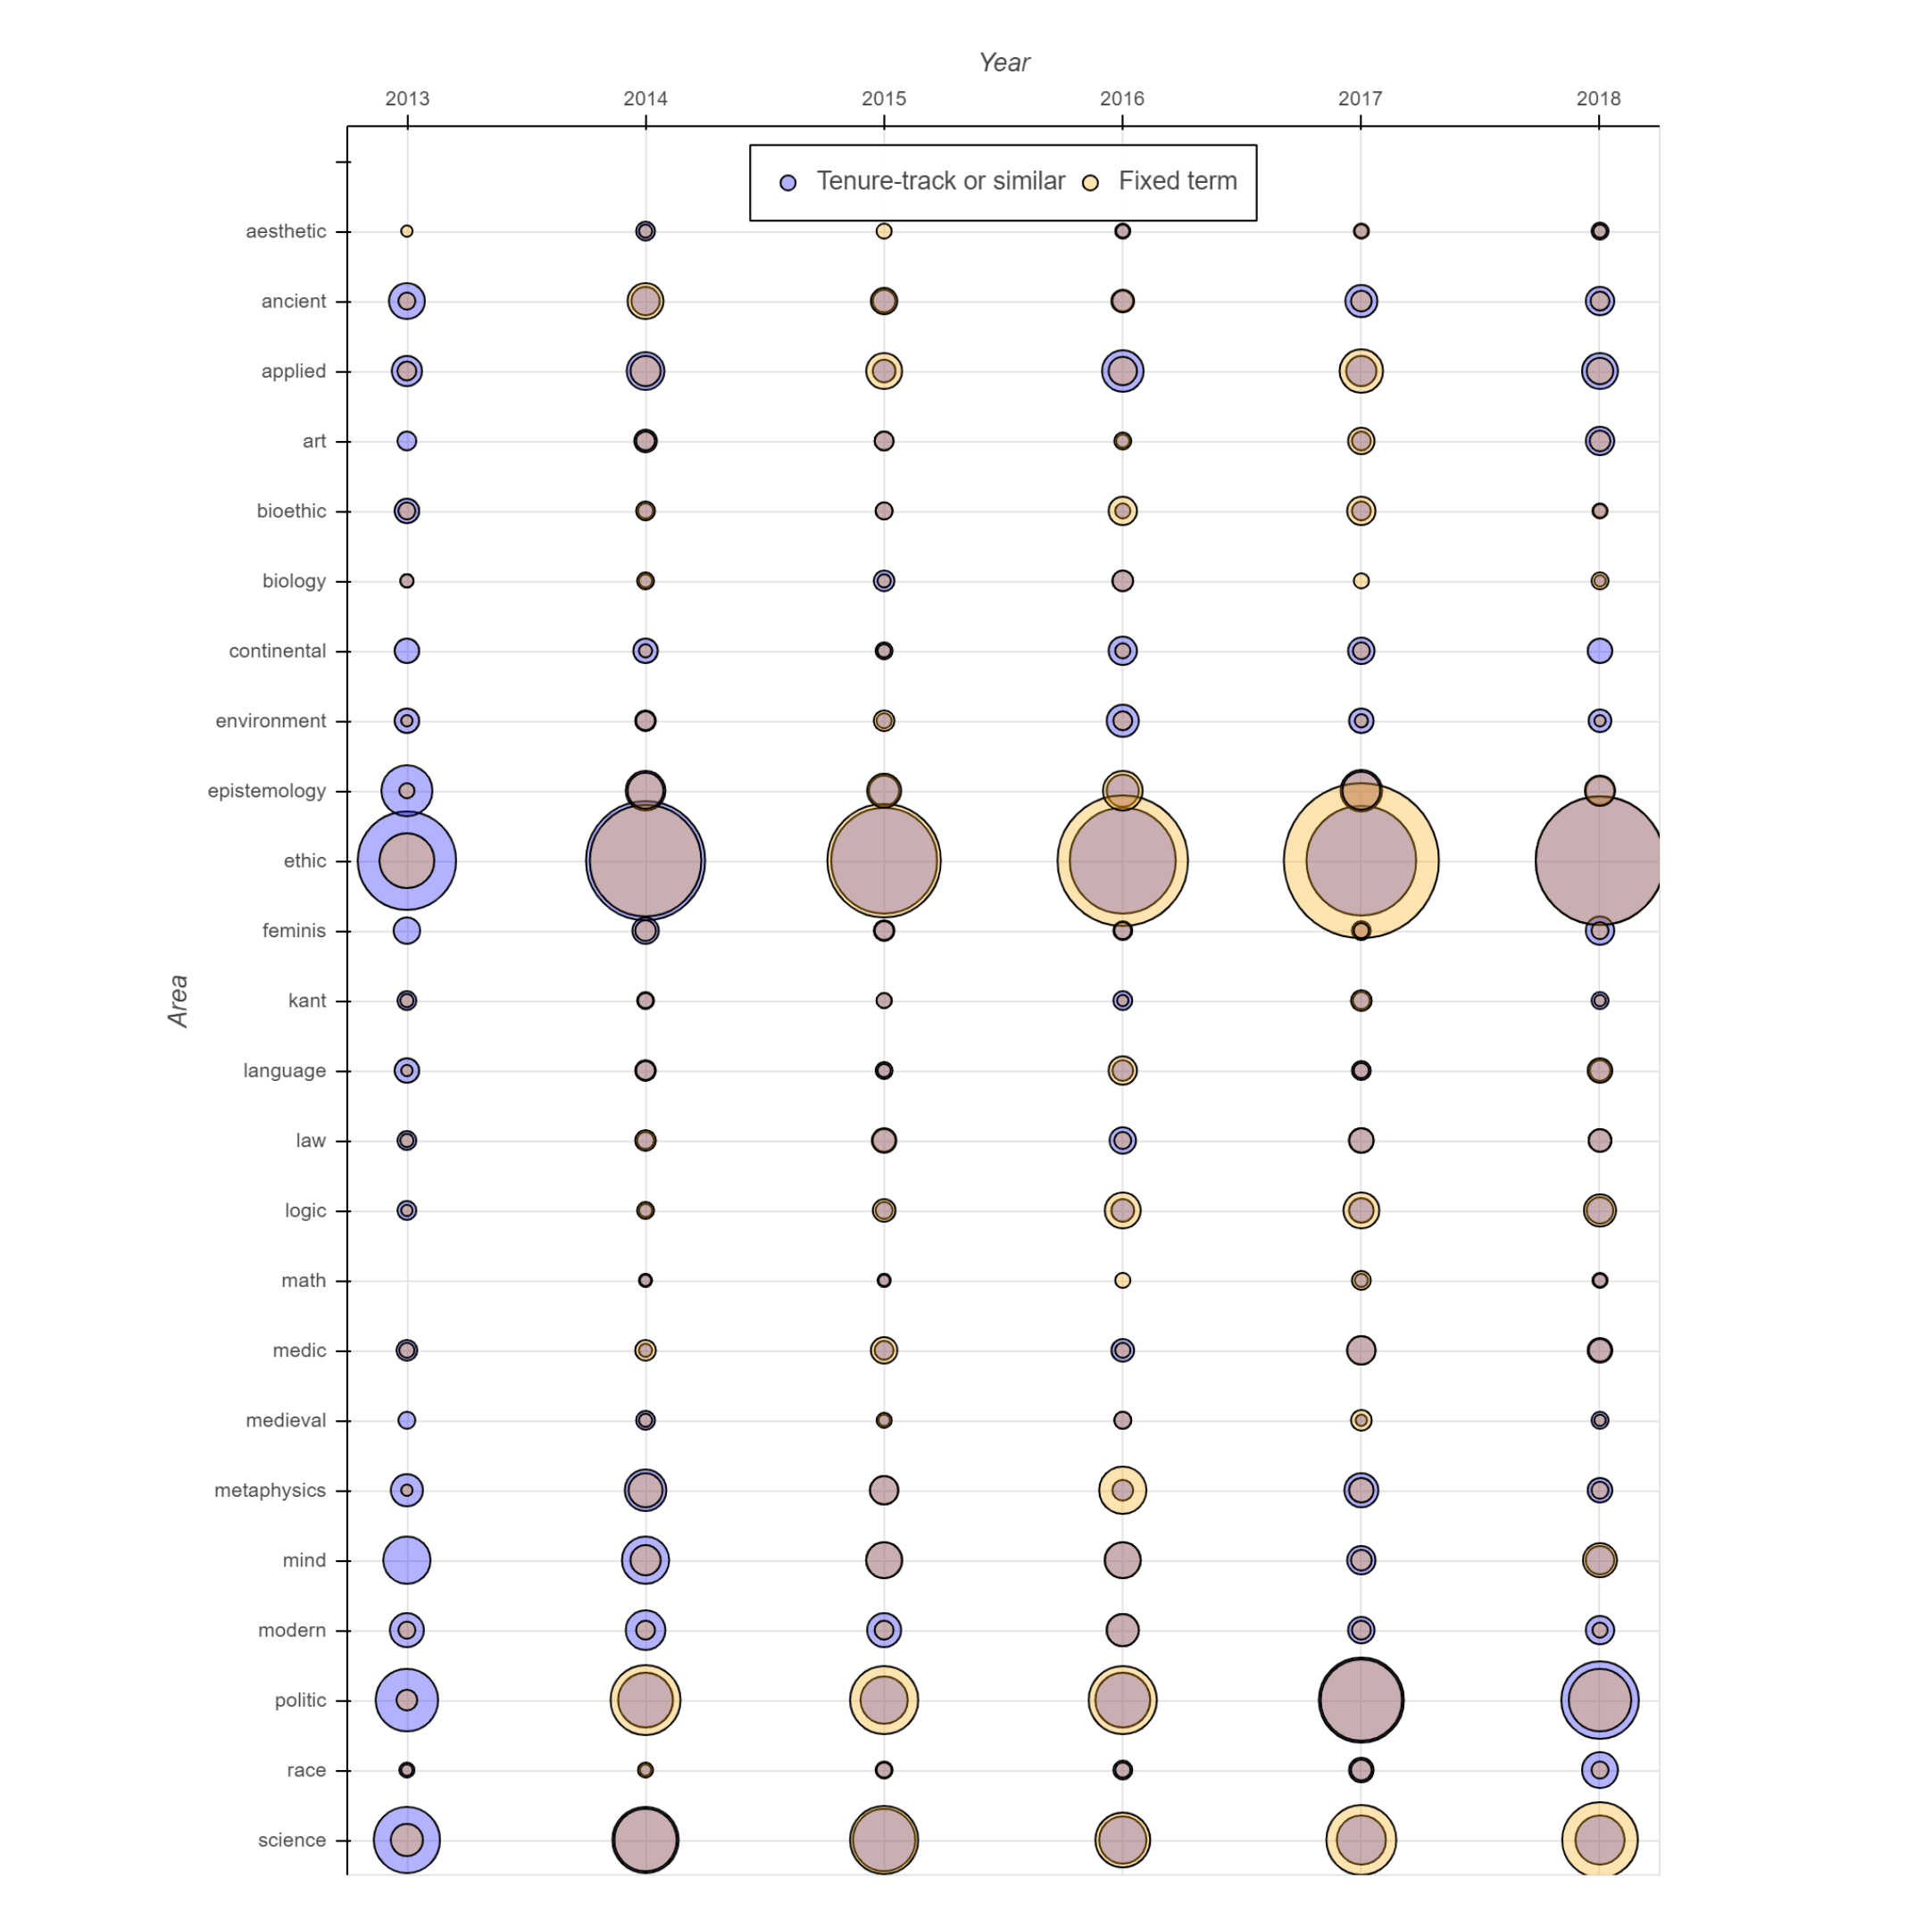
The following graph shows the number of tenure-track job opportunities each year (blue bubbles) and fixed-term opportunities (yellow bubbles), classed by area of specialization. (Since the bubbles are semi-transparent and at times overlap, parts may appear taupe/dark pink.)
Philosophy Job Market Analysis: Trends by Area of Specialization. By Aero Data Lab.
I encourage readers to visit the Aero Data Lab post on this, as their version of the graph is interactive, and Hey provides an explanation of how it was made.
As for the results, Hey remarks that the positions in ethics “consistently sees 50+ opportunities both for tenure track and fixed term positions” and that jobs related to political philosophy and philosophy of science “are also looking relatively strong, with 20-30 opportunities each year.” He writes: “for new graduate students in search of a project that is likely to increase their job market desirability, working on the ethical, social, or political implications of science would seem like a safe bet.”
Additionally:
In terms of trends over time, most of the AOS’s fluctuate between 5-15 jobs/year. There appears to be a slight downward trend for “ancient” and “mind,” and a recent uptick of interest in “race”. However, the lack of big changes over time is also interesting, and worth thinking about for new graduate students as they develop and shape their projects. For example, in the past 6 years, there have only ever been a handful of opportunities in math, medieval, and aesthetics—even for fixed term positions. So if your main area of interest is more niche, it may be prudent to think about building a connection to a higher demand AOS in order to increase your future academic job opportunities.
The full post is here.

Curious to see to see if this could be combined with numbers on grad students in each area e.g. if there are usually more than 5x as many students in Ethics than in Language, you may theoretically have less competition in the job market staying with Language.
This does not really answer your question because 1) it generally might not be representative because who uses the site and respond to the survey might correlate with one’s AoS, 2) it does not look specifically at recent graduate students, and 3) it might not capture recent AoS trends and changes, but it may be a starting point, especially given that most respondents were in their 30s and 40s: https://philpapers.org/surveys/demographics.pl
A few things (which I hope don’t come across as overly critical — I appreciate the analysis!):
1. These data don’t include AOS open positions (at least ones that don’t list a preferred or desired specialization under the AOS field), which of course could go to candidates in those “niche” areas that don’t seem to be heavily advertised for. One way to address this would be to look instead at the AOSes (A’s ofS?) of candidates who actually get hired.
2. I agree with the commenter above that we don’t really have a sense of how competitive an AOS is unless we know how many job candidates there are who work in it. So while I think it’s *likely* that, all else being equal, one’s job prospects are better with an AOS in ethics rather than, say, medieval phil. or phil. of math, these data can’t really do much to support that intuition.
3. It’s also important to remember that in many cases all else is NOT equal. So while it’s good to come up with a project that one can market effectively to real-life hiring committees, it’s also a very bad idea to work on something that you don’t feel passionate about, or that doesn’t draw on one’s distinctive points of expertise. If a graduate student came to me with the proposal to work “on the ethical, social, or political implications of science” and explained this choice by saying that this would increase their job market desirability, I’d tell them to go back to square one.
4. It also seems unwise to eyeball any trends from these data, no matter how “slight” or “tick”-like they are. There is just too much inherent variation, and too short a time period, for comparisons of the sizes of those circles — or the numbers they represent — to tell us anything meaningful.
These data are extraordinarily helpful, but as other commenters have pointed out, they aren’t a good way of trying to figure out whether a given AOS would be good or bad for one’s job prospects. (This is not a criticism of the original post itself, which is clearly a very helpful one.)
For data about job prospects by AOS, the best source is the APDA:
http://www.placementdata.com/blog/
This yields a very different picture. For example, the percentage of people with an AOS in cognitive science who successfully got a tenure-track job was very high (slightly higher even than the percentage for moral philosophy). Of course, there are many more jobs in moral philosophy, but since there are also many more candidates competing for those jobs, philosophers who work in cognitive science end up doing quite well.
This is helpful. But my point above about the danger of eyeballing trends, especially from such limited and imperfect data, applies in turn here.
John,
Fair enough, but it is worth pointing out the APDA data paint a surprisingly consistent picture. For example, philosophy of cognitive science, philosophy of physics and philosophy of biology all have a high placement rate, whereas metaphysics, epistemology and metaethics all have a low placement rate. In other words, the results clearly aren’t just a bunch of random noise; there is an easily discernible pattern.
That’s relevant, sure — but not all non-random patterns are significant (statistically or otherwise), and the usual caveats about cause / correlation, plus the varied meanings of “placement”, apply regardless.
Hi John,
Good point about correlation vs. causation. It’s always possible that the kinds of people who go into cognitive science are just different in various other respects from the kinds of people who go into metaphysics or epistemology, and that the kinds of people who go into cognitive science are more likely to get jobs.
Thanks, Data! For those interested, I am going to try to start doing a weekly post that focuses on two randomly selected programs. Hopefully this will help to keep the database up to date and also highlight special features of each program. This week’s are Brown and Ohio State. Feedback is welcome! http://placementdata.com:8182/philosophy-phd-programs-brown-university-and-ohio-state-university/
I’m surprised to see that this figure came out of a “data lab.” Presenting numerical comparisons via the relative size of two-dimensional bubbles is a textbook example of a dubious data visualization practice. Sometimes there are good uses for bubble plots, like if there is some underlying relevant spatial distribution to the data (e.g., plotting bubbles on a map according to the location of the data collected). Here, however, there is no spatial aspect to this data. Add to that, it’s often unclear from these plots how the size of the bubbles are determined. It is area? Diameter? Who knows? (Actually, in this case it looks like they use diameter, but you have to figure this out for yourself.) In any case, people are generally not very good at determining an accurate numerical (one-dimensional) comparison by eyeballing the relative sizes of (two-dimensional) bubbles. To make it worse, here they present their complete dataset as two sets of overlapping bubbles.