
Philosophy Placement Data: An Update on APDA
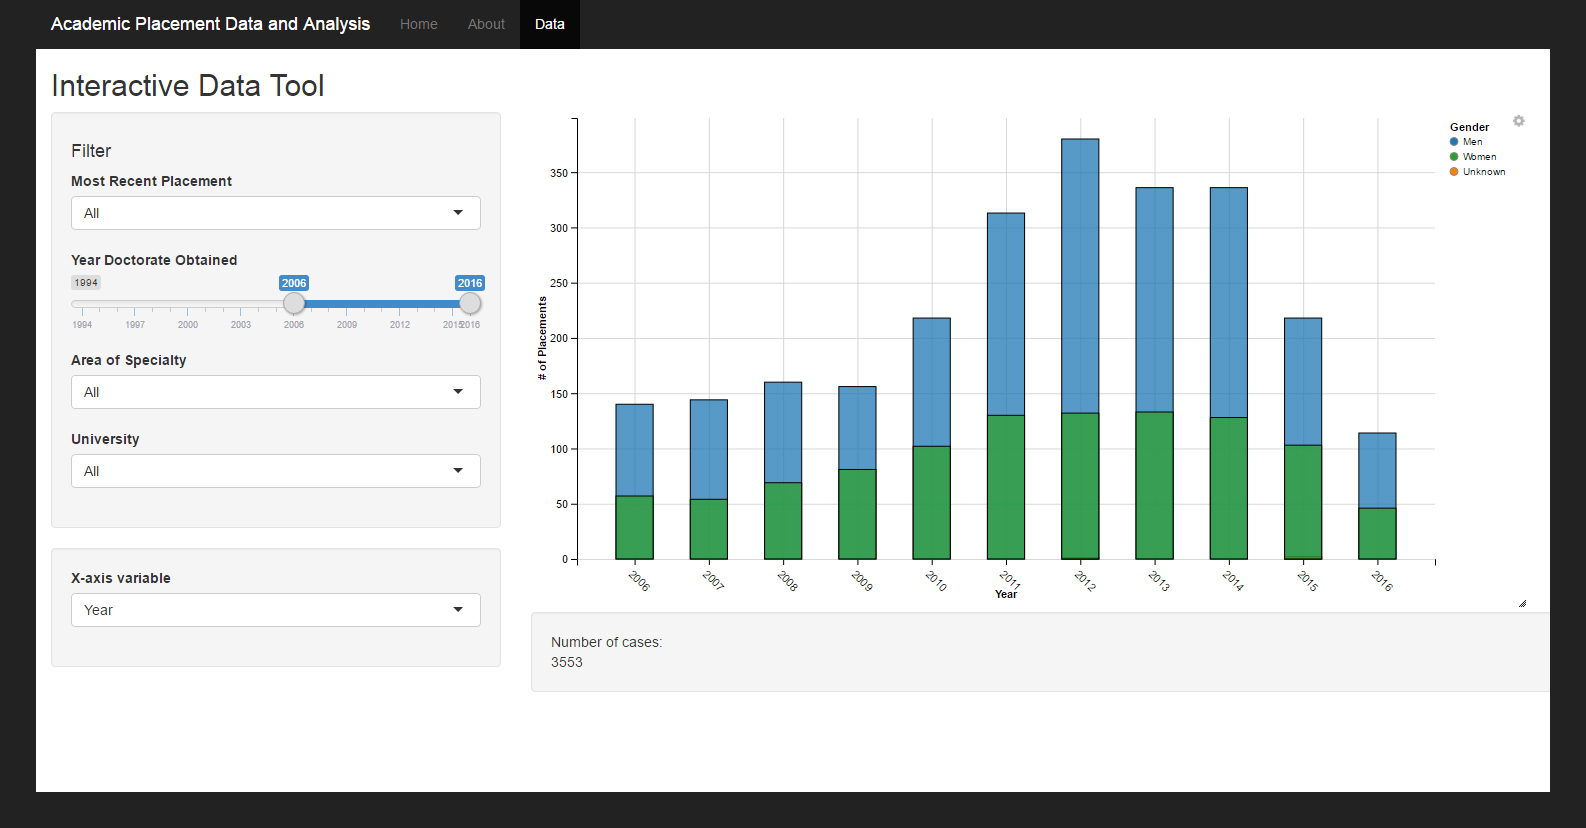
Academic Placement Data and Analysis (APDA), a project funded by the American Philosophical Association (APA) and headed by Carolyn Dicey Jennings (UC Merced), aims “to make information on academic job placement useful to prospective graduate students in philosophy.” The project has just been updated to include new data, which Professor Jennings describes in a post at New APPS. She also announces a new interactive data tool with which one can sift through and sort information, that looks like this:
The APDA 2016 Final Report informs us that the database has grown:
The graphs below are based graduates from between 2012 and 2016. Jennings writes, “We have not yet started checking new data (program representatives have added over 400 graduates since August 15th), so there may be some errors (including those noted here). We are currently working on writing up some results from the survey into one or more papers, which should be available sometime in early 2017. Feedback is welcome!”
See the New APPS post and the APDA site for further details.

This is important work. But it seems to contain some errors. For example, for my own phd-granting institution, UNC Chapel Hill, it appears that only 1 woman was hired to a TT-job in 2004, when I know for certain that at least 2 women and 1 man got TT-jobs that year. My guess is that this is not an isolated error. Perhaps it is. Anyone else care to check their institution’s data for themselves?
If it turns out that these errors are widespread, I worry that many people will rely on what might be very inaccurate data that is so easily accessible on this nicely designed website in order to draw what are likely to be a lot of false conclusions.
Any comments from the creators? This is important work – I want to stress! – and I hope it is completed. But, it seems important that it is done well.
Thanks for this Matthew–we typically restrict program-specific reports to graduation years after 2012, because those are the years for which we have more complete data (and have aimed to have more complete data). You can see in the app that we have around 60 total placements in 2004, 40 something of which are tenure-track. The more complete years have between 300 and 400 placements with less than half in tenure-track jobs. So 2004 is not representative. We wanted the app to allow users to see all of the data that we have. That said, I will think about issues like this as we develop this and other apps over the next year.
Perhaps worth adding: we selected the above programs (in the charts included in this post and at NewAPPS) because program representatives from those programs checked our data (in 2015) and we also checked the data (from August 2015 to January 2016) by going to their placement pages. We have reason to believe that we have fairly complete records for these programs for these years. Our biggest concern, currently, is the “unknown placements” group, which is large for some programs–is this an error in one or more of the three graduate databases we used, our method of combining the information from those databases, or a sign that we are missing quite a bit of information for those programs? If the latter, what is the best way of capturing it, given that it is not on the placement page nor from program representatives? A next step could be to use the information publicly available on, say, ProQuest, but this is a very time-intensive check for various reasons. In any case, if you know of errors, please do let us know! We want our data to be as accurate as possible. But know that we have taken several steps to ensure our database is in good order before we started developing these apps.
Thanks for responding. Maybe you should distinguish the two data sets by not allowing searching across data sets within the same application? For, as it stands, a casual user will assume that the quality of the data for 2004 is the same as post-2012.
This is meant as a friendly suggestion, btw.
It is a great point and suggestion. Maybe we could also add a note and something like asterisks to point out that some years are considered incomplete…I will think about it, talk to Patrice Cobb (who designed the app), and hopefully find a solution. Thank you.
The graph indicates that there were fewer than 20 TT placements in 2016. Am I reading that correctly? That seem far too low.
I gather from the name of this body that you’re not the ultimate ones to whom I should direct this inquiry, but is there going to be a similar effort for tracking non-academic career trajectories? I don’t know what the percentage is in our discipline, but for the overall PhD population, 53% of PhD students take non-academic employment. (This figure comes from Council of Graduate Schools.)